股价统计分析
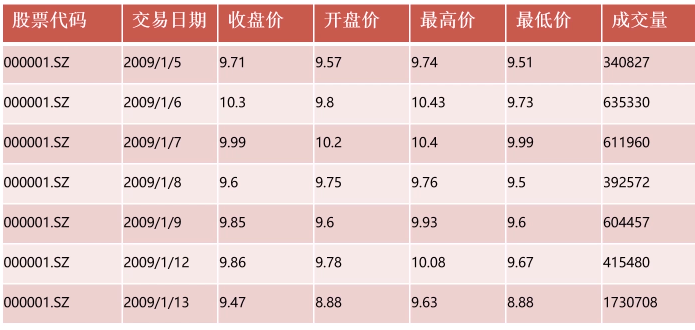
数据样本

股价常用指标
极差
越高说明波动越明显
股价近期最高价的最大值和最小值的差价
成交量加权平均价格
英文名VWAP(Volume-Weighted Average Price,成交量加权平均价格)是一个非常重要的经济学量,代表着金融资产的“平均”价格
收益率
简单收益率,相邻两个价格之间的变化率
对数收益率,指所有价格取对数后两两之间的差值
波动率
越高说明波动越明显
波动率是对价格变动的一种衡量
年波动率
对数波动率的标准差除以其均值,再除以交易日倒数的平方根,通常交易日取250天
月波动率
对数收益率的标准差除以其均值,再乘以交易月的平方根通常交易月取12月
读取指定列
""" 读取指定列numpy.loadtxt需要传入4个关键字参数:1.fname是文件名,数据类型为字符串str;2.delimiter是分隔符,数据类型为字符串str;3.usecols是读取的列数,数据类型为元组tuple, 其中元素个数有多少个,则选出多少列;4.unpack是是否解包,数据类型为布尔bool。#"""def testReadFile(self):file_name = r"D:\lhjytest\demo.csv"end_price,volumn = np.loadtxt(fname=file_name,delimiter=',',usecols=(2,6),unpack=True)print(end_price)print(volumn)

#计算最大值与最小值
def testMaxAndMin(self):file_name = r"D:\lhjytest\demo.csv"high_price,low_price = np.loadtxt(fname=file_name,delimiter=',',usecols=(4,5),unpack=True)print("max_price = {}".format(high_price.max()))print("min_price = {}".format(low_price.min()))

计算极差
# 计算股价近期最高价的最大值和最小值的差值 和 计算股价近期最低价的最大值和最小值的差值
def testPtp(self):file_name = r"D:\lhjytest\demo.csv"high_price, low_price = np.loadtxt(fname=file_name,delimiter=',',usecols=(4, 5),unpack=True)print("max - min of high price : {}".format(np.ptp(high_price)))print("max - min of low price : {}".format(np.ptp(low_price)))

计算成交量加权平均价格
# 成交量加权平均价格,英文名VWAP(Volume-Weighted Average Price,成交量加权平均价格)是一个非常重要的经济学量,代表着金融资产的“平均”价格def testAVG(self):file_name = r"D:\lhjytest\demo.csv"end_price, volumn = np.loadtxt(fname=file_name,delimiter=',',usecols=(2, 6),unpack=True)print("avg_price = {}".format(np.average(end_price)))print("VWAP = {}".format(np.average(end_price,weights=volumn)))

计算中位数
# 收盘价的中位数def testMedian(self):file_name = r"D:\lhjytest\demo.csv"end_price, volumn = np.loadtxt(fname=file_name,delimiter=',',usecols=(2, 6),unpack=True)print("median = {}".format(np.median(end_price)))

计算方差
# 收盘价的方差def testVar(self):file_name = r"D:\lhjytest\demo.csv"end_price, volumn = np.loadtxt(fname=file_name,delimiter=',',usecols=(2, 6),unpack=True)print("var = {}".format(np.var(end_price)))print("var = {}".format(end_price.var()))

计算股票收益率、年波动率及月波动率
# 波动率是对价格变动的一种度量,历史波动率可以根据历史价格数据计算得出。计算历史波动率时,需要用到对数收益率# 年波动率等于对数收益率的标准差除以其均值,再乘以交易日的平方根,通常交易日取250天# 月波动率等于对数收益率的标准差除以其均值,再乘以交易月的平方根。通常交易月取12月def testVolatility (self):file_name = r"D:\lhjytest\demo.csv"end_price, volumn = np.loadtxt(fname=file_name,delimiter=',',usecols=(2, 6),unpack=True)log_return = np.diff(np.log(end_price))annual_volatility = log_return.std() / log_return.mean() * np.sqrt(250)monthly_volatility = log_return.std() / log_return.mean() * np.sqrt(12)print("log_return = {}".format(log_return))print("annual_volatility = {}".format(annual_volatility))print("monthly_volatility = {}".format(monthly_volatility))

股价均线
卷积
卷积可用于描述过去作用对当前的影响。卷积是时空响应的叠加,可用作计算“滑动平均”
简单移动均线
一般用于分析时间序列上的股价趋势计算股价与等权重的指示函数的卷积
生成权重-卷积运算-均线可视化
指数移动均线
历史数据的权重以指数速度衰减计算股价与权重衰减的指示函数的卷积
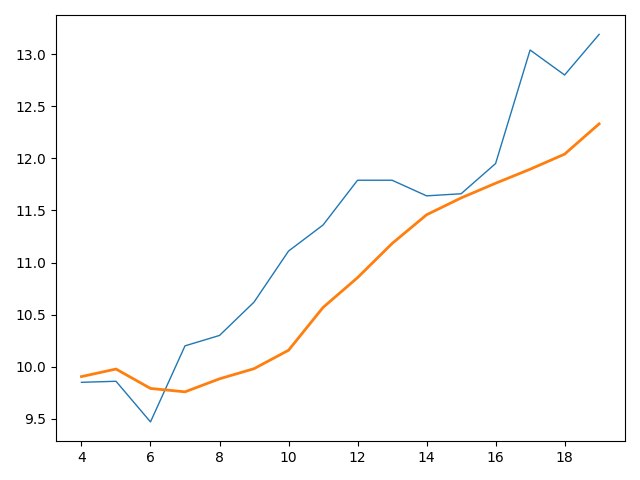
权重初始化-权重衰减-卷积运算-均线可视化
class TestNumpyMA(TestCase):
# 简单移动均线def testSMA(self):file_name = r"D:\lhjytest\demo.csv"end_price = np.loadtxt(fname=file_name,delimiter=',',usecols=(2),unpack=True)print(end_price)# 生成权重N = 5weights = np.ones(N) / Nprint(weights)# 卷积运算sma = np.convolve(weights,end_price)[N-1:-N+1]print(sma)# 均线可视化plt.plot(sma,linewidth=5)plt.show()def testEXP(self):x = np.arange(5)y = np.arange(10)print("x", x)  # exp 函数可以计算出每个数组元素的指数print("y", y)# 指数衰减print("""Exp x : {}""".format(np.exp(x)))print("""Exp y : {}""".format(np.exp(y)))print("""Linespace : {}""".format(np.linspace(-1,0,5)))def testEMA(self):file_name = r"D:\lhjytest\demo.csv"end_price = np.loadtxt(fname=file_name,delimiter=',',usecols=(2),unpack=True)print(end_price)N = 5# 权重衰减weighs = np.exp(np.linspace(-1,0,N))# 归一化weighs /= weighs.sum()print(weighs)# 卷积运算ema = np.convolve(weighs,end_price)[N-1:-N+1]print(ema)# 均线可视化t = np.arange(N-1,len(end_price))plt.plot(t,end_price[N-1:],lw=1.0)plt.plot(t,ema,lw=2.0)plt.show()


)


)


)
)


