目录
1.rc参数设置
1.1 lines.linestype取值
1.2 lines.marker参数的取值
1.3 绘图中文预设
1.4 示例
1.4.1 示例1
1.4.2 示例2
1.rc参数设置
利用matplotlib绘图时为了让绘制出的图形更加好看,需要对参数进行设置rc参数设置。可以通过以下代码查看matplotlib的rc参数。
import matplotlib as plt
print(plt.rc_params())
常用rc参数如下:
- lines.linewidth:线条宽度
- lines.linestyle:线条样式
- lines.marker:线条上点的形状
- lines.markersize:点的大小
1.1 lines.linestype取值
- "-":实线
- "--":长虚线
- "-.":点线
- ":":短虚线
1.2 lines.marker参数的取值
| marker取值 | 意义 |
| ‘o’ | 圆圈 |
| 'D' | 菱形 |
| 'H' | 六边形 |
| '-' | 水平线 |
| '8' | 八边形 |
| 'p' | 五边形 |
| '+' | 加号 |
| '.' | 点 |
| 's' | 正方形 |
| 'd' | 小菱形 |
| ' * ' | 星号 |
1.3 绘图中文预设
plt.rcParams['font.family']=['SimHei']
plt.rcParams['axes.unicode_minus']=False
1.4 示例
1.4.1 示例1
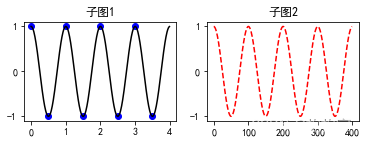
import matplotlib.pyplot as plt
import numpy as np
fig ,axes = plt.subplots()
#配置中文显示
plt.rcParams['font.family'] = ['SimHei']
plt.rcParams['axes.unicode_minus'] = False
def f(t):return np.cos(2*np.pi*t)
x1 = np.arange(0.0,4.0,0.5)
x2 = np.arange(0.0,4.0,0.01)
plt.figure(1)
plt.subplot(2,2,1)
plt.plot(x1,f(x1),'bo',x2,f(x2),'k')
plt.title('子图1')
plt.subplot(2,2,2)
plt.plot(np.cos(2*np.pi*x2),'r--')
plt.title('子图2')
plt.show()
结果:

1.4.2 示例2
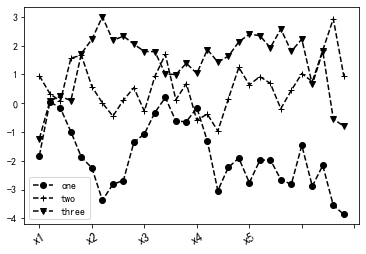
fig = plt.figure()
ax = fig.add_subplot(1,1,1)
ax.plot(np.random.randn(30).cumsum(),color = 'k',linestyle = 'dashed',marker = 'o',label = 'one')
ax.plot(np.random.randn(30).cumsum(),color = 'k',linestyle = 'dashed',marker = '+',label = 'two')
ax.plot(np.random.randn(30).cumsum(),color = 'k',linestyle = 'dashed',marker = 'v',label = 'three')
ax.set_xticklabels(['x0','x1','x2','x3','x4','x5'],rotation = 30,fontsize = 'large')
ax.legend(loc = 'best')
结果:

 condition_variable、wait、notify_one、notify_all)

![[Machine Learning] decision tree 决策树](http://pic.xiahunao.cn/[Machine Learning] decision tree 决策树)


 创建UDR外部函数)
)
)


?为什么它在JavaScript中很有用?)


-JS句柄)

