数据特征分析-分布分析

分布分析用于研究数据的分布特征,常用分析方法:

1、极差

2、频率分布

3、分组组距及组数

df = pd.DataFrame({'编码':['001','002','003','004','005','006','007','008','009','010','011','012','013','014','015'],\'小区':['A村','B村','C村','D村','E村','A村','B村','C村','D村','E村','A村','B村','C村','D村','E村'],\'朝向':['south','east_north','south','east_south','eath_south','north','east_north','west_north','south','west','north','east_north','south','south','east'],\'单价':[7374,6435,6643,5874,6738,6453,5733,6034,5276,5999,6438,5864,6099,5699,6999],\'首付':[15,7.5,18,10,30,10,18,30,40,30,20,22,29,30,40],\'总价':[50,65,68,73,80,55,45,70,59,57,40,60,50,48,60],\'经度':[114.0,114.6,114.8,114.2,114.5,114.3,114.4,114.7,114.9,114.1,114.8,114.2,114.5,114.3,114.8],\'纬度':[22.0,22.4,22.6,22.8,22.2,22.1,22.7,22.5,22.9,22.3,22.8,22.2,22.1,22.7,22.5]    }) 


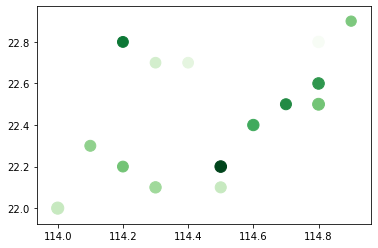
先对总体做关于经纬度的散点图

plt.scatter(df['经度'],df['纬度'],s = df['单价']/50,c = df['总价'],cmap='Greens')   #原点的大小可以表示单价,越大单价越高;颜色深浅可以表示总价,越深总价越高
 

 求总价、单价和首付的极差

def d_range(df,*cols):krange = []for c in cols:crange = df[c].max() - df[c].min()krange.append(crange)return ('%s极差:%s\n%s极差:%s\n%s极差:%s'%(cols[0],krange[0],cols[1],krange[1],cols[2],krange[2]))
print(d_range(df,'总价','单价','首付'))
# 总价极差:40
# 单价极差:2098
# 首付极差:32.5


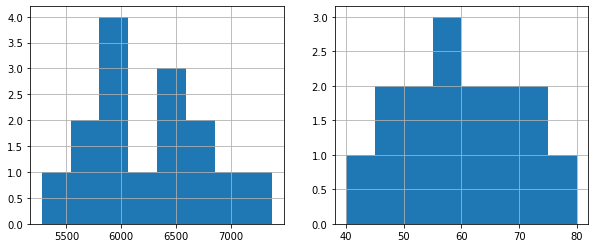
单价和总价的频率分布

fig,axes = plt.subplots(1,2,figsize = (10,4))
df['单价'].hist(bins = 8,ax = axes[0])
df['总价'].hist(bins = 8,ax = axes[1])
 

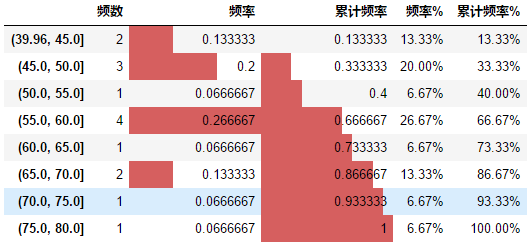
将总价分为8个区间,求出每个区间的频数、频率,并求出累计频率

# 频率分布,分组区间
total_range = pd.cut(df['总价'],8)   #通过cut将总价分为8个区间
total_range_count = total_range.value_counts(sort=False)   #求每个区间的个数,结果为一个Seris,不按列的大小排序
total_range_s = pd.DataFrame(total_range_count)  #将Seris转化为DataFrame,生成一个用于统计总价的DataFrame
# # total_range_s.rename(columns = {total_range_count.name:'频数',inplace = True})
total_range_s.columns = ['频数']  #给转化后的DataFrame重命名列
df['区间'] = total_range.values  #给原数据加一列区间
total_range_s['频率'] = total_range_s['频数']/total_range_s['频数'].sum()  #求总价在每个区间出现的频率
total_range_s['累计频率'] = total_range_s['频率'].cumsum()   ##求总价在每个区间的累计频率
total_range_s['频率%'] = total_range_s['频率'].apply(lambda x:'%.2f%%'%(100*x))  #格式化频率列,显示为2位百分数
total_range_s['累计频率%'] = total_range_s['累计频率'].apply(lambda x:'%.2f%%'%(100*x))#格式化频率列,显示为2位百分数
total_range_s.style.bar(subset = ['频率','累计频率'])
 

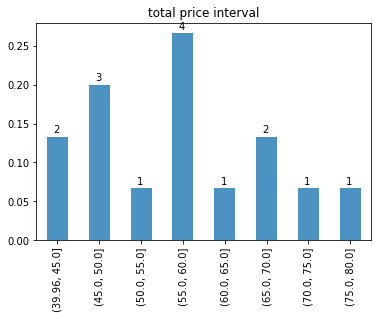
 对每个总价区间出现的频率做柱状图

total_range_s['频率'].plot(kind = 'bar',alpha = 0.8,title ='total price interval')
x = range(len(total_range_s.index))
for i,j,k in zip(x,total_range_s['频率'],total_range_s['频数']):plt.text(i,j+0.01,k)


对于单个字段比如朝向,做频率统计分析

# 频率分布 定性字段
cx = df['朝向'].value_counts()
cx_s = pd.DataFrame(cx)
cx_s.columns = ['频数']
cx_s['频率'] = cx_s['频数']/cx_s['频数'].sum()
cx_s['累计频率'] = cx_s['频率'].cumsum()
cx_s['频率%'] = cx_s['频率'].apply(lambda x:'%.2f%%'%(100*x))
cx_s['累计频率%'] = cx_s['累计频率'].apply(lambda x:'%.2f%%'%(100*x))
cx_s.style.bar(subset = ['频率','累计频率'] )


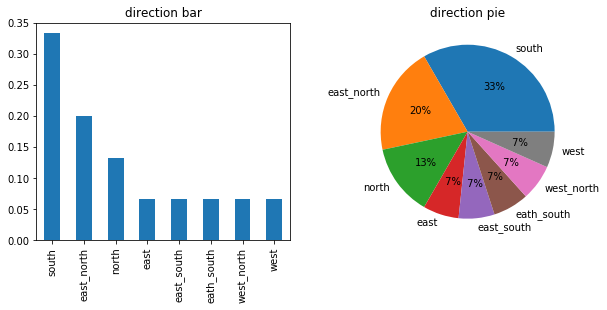
 对朝向做柱状图和饼图

fig,axes = plt.subplots(1,2,figsize = (10,4))
cx_s['频率'].plot(kind = 'bar',ax = axes[0],title = 'direction bar')   plt.pie(cx_s['频数'],labels=cx_s.index,autopct='%2.f%%')
plt.title('direction pie')
 

转载于:https://www.cnblogs.com/Forever77/p/11344050.html

本文来自互联网用户投稿,该文观点仅代表作者本人,不代表本站立场。本站仅提供信息存储空间服务,不拥有所有权,不承担相关法律责任。如若转载,请注明出处:http://www.mzph.cn/news/391721.shtml

如若内容造成侵权/违法违规/事实不符,请联系多彩编程网进行投诉反馈email:809451989@qq.com,一经查实,立即删除!

相关文章

开发工具总结(2)之全面总结Android Studio2.X的填坑指南

前言:好多 Android 开发者都在说Android Studio太坑了,老是出错,导致开发进度变慢,出错了又不知道怎么办,网上去查各种解决方案五花八门,有些可以解决问题,有些就是转来转去的写的很粗糙&#x…

无聊的一天_一人互联网公司背后的无聊技术

无聊的一天Listen Notes is a podcast search engine and database. The technology behind Listen Notes is actually very very boring. No AI, no deep learning, no blockchain. “Any man who must say I am using AI is not using True AI” :)Listen Notes是一个播客搜索…

如何在Pandas中使用Excel文件

From what I have seen so far, CSV seems to be the most popular format to store data among data scientists. And that’s understandable, it gets the job done and it’s a quite simple format; in Python, even without any library, one can build a simple CSV par…

Js实现div随鼠标移动的方法

HTML: <div id"odiv" style" COLOR: #666; padding: 2px 8px; FONT-SIZE: 12px; MARGIN-RIGHT: 5px; position: absolute; background: #fff; display: block; border: 1px solid #666; top: 50px; left: 10px;"> Move_Me</div>第一种&…

leetcode 867. 转置矩阵

给你一个二维整数数组 matrix&#xff0c; 返回 matrix 的 转置矩阵 。 矩阵的 转置 是指将矩阵的主对角线翻转&#xff0c;交换矩阵的行索引与列索引。 示例 1&#xff1a; 输入&#xff1a;matrix [[1,2,3],[4,5,6],[7,8,9]] 输出&#xff1a;[[1,4,7],[2,5,8],[3,6,9]] …

数据特征分析-对比分析

对比分析是对两个互相联系的指标进行比较。 绝对数比较(相减)&#xff1a;指标在量级上不能差别过大&#xff0c;常用折线图、柱状图 相对数比较(相除)&#xff1a;结构分析、比例分析、空间比较分析、动态对比分析 df pd.DataFrame(np.random.rand(30,2)*1000,columns[A_sale…

Linux基线合规检查中各文件的作用及配置脚本

1./etc/motd 操作&#xff1a;echo " Authorized users only. All activity may be monitored and reported " > /etc/motd 效果&#xff1a;telnet和ssh登录后的输出信息 2. /etc/issue和/etc/issue.net 操作&#xff1a;echo " Authorized users only. All…

tableau使用_使用Tableau升级Kaplan-Meier曲线

tableau使用In a previous article, I showed how we can create the Kaplan-Meier curves using Python. As much as I love Python and writing code, there might be some alternative approaches with their unique set of benefits. Enter Tableau!在上一篇文章中 &#x…

踩坑 net core

webclient 可以替换为 HttpClient 下载获取url的内容&#xff1a; 证书&#xff1a; https://stackoverflow.com/questions/40014047/add-client-certificate-to-net-core-httpclient 转载于:https://www.cnblogs.com/zxs-onestar/p/7340386.html

我从参加#PerfMatters会议中学到的东西

by Stacey Tay通过史黛西泰 我从参加#PerfMatters会议中学到的东西 (What I learned from attending the #PerfMatters conference) 从前端的网络运行情况发布会上的注意事项 (Notes from a front-end web performance conference) This week I had the privilege of attendin…

修改innodb_flush_log_at_trx_commit参数提升insert性能

最近&#xff0c;在一个系统的慢查询日志里发现有个insert操作很慢&#xff0c;达到秒级&#xff0c;并且是比较简单的SQL语句&#xff0c;把语句拿出来到mysql中直接执行&#xff0c;速度却很快。 这种问题一般不是SQL语句本身的问题&#xff0c;而是在具体的应用环境中&#…

leetcode 1178. 猜字谜(位运算)

外国友人仿照中国字谜设计了一个英文版猜字谜小游戏&#xff0c;请你来猜猜看吧。 字谜的迷面 puzzle 按字符串形式给出&#xff0c;如果一个单词 word 符合下面两个条件&#xff0c;那么它就可以算作谜底&#xff1a; 单词 word 中包含谜面 puzzle 的第一个字母。 单词 word…

Nexus3.x.x上传第三方jar

exus3.x.x上传第三方jar&#xff1a; 1. create repository 选择maven2(hosted)&#xff0c;说明&#xff1a; proxy&#xff1a;即你可以设置代理&#xff0c;设置了代理之后&#xff0c;在你的nexus中找不到的依赖就会去配置的代理的地址中找hosted&#xff1a;你可以上传你自…

责备的近义词_考试结果危机:我们应该责备算法吗?

责备的近义词I’ve been considering writing on the topic of algorithms for a little while, but with the Exam Results Fiasco dominating the headline news in the UK during the past week, I felt that now is the time to look more closely into the subject.我一直…

电脑如何设置终端设置代理_如何设置一个严肃的Kubernetes终端

电脑如何设置终端设置代理by Chris Cooney克里斯库尼(Chris Cooney) 如何设置一个严肃的Kubernetes终端 (How to set up a serious Kubernetes terminal) 所有k8s书呆子需要的CLI工具 (All the CLI tools a growing k8s nerd needs) Kubernetes comes pre-packaged with an ou…

spring cloud(二)

1. Feign应用 Feign的作用&#xff1b;使用Feign实现consumer-demo代码中调用服务 导入启动器依赖&#xff1b;开启Feign功能&#xff1b;编写Feign客户端&#xff1b;编写一个处理器ConsumerFeignController&#xff0c;注入Feign客户端并使用&#xff1b;测试 <dependen…

c/c++编译器的安装

MinGW(Minimalist GNU For Windows)是个精简的Windows平台C/C、ADA及Fortran编译器&#xff0c;相比Cygwin而言&#xff0c;体积要小很多&#xff0c;使用较为方便。 MinGW最大的特点就是编译出来的可执行文件能够独立在Windows上运行。 MinGW的组成&#xff1a; 编译器(支持C、…

渗透工具

渗透工具 https://blog.csdn.net/Fly_hps/article/details/89306104 查询工具 https://blog.csdn.net/Fly_hps/article/details/89070552 转载于:https://www.cnblogs.com/liuYGoo/p/11347693.html

numpy 线性代数_数据科学家的线性代数—用NumPy解释

numpy 线性代数Machine learning and deep learning models are data-hungry. The performance of them is highly dependent on the amount of data. Thus, we tend to collect as much data as possible in order to build a robust and accurate model. Data is collected i…

spring 注解方式配置Bean

概要&#xff1a; 再classpath中扫描组件 组件扫描&#xff08;component scanning&#xff09;&#xff1a;Spring可以从classpath下自己主动扫描。侦測和实例化具有特定注解的组件特定组件包含&#xff1a; Component&#xff1a;基本注解。标示了一个受Spring管理的组件&…