蒙特卡洛模拟预测股票
In a previous article, I outlined the limitations of conventional time series models such as ARIMA when it comes to forecasting extreme temperature values, which in and of themselves are outliers in the time series.
在上一篇文章中 ,我概述了常规时间序列模型(如ARIMA)在预测极端温度值时的局限性,而极端温度值本身就是时间序列中的异常值。
When dealing with extreme values, a Monte Carlo simulation can be a better solution in terms of quantifying the probability of an extreme event occurring.
在处理极端值时,就量化极端事件发生的可能性而言,蒙特卡洛模拟可能是更好的解决方案。
背景 (Background)
In the last example, the mean minimum monthly temperature values for Braemar, Scotland were used in training and validating an ARIMA model forecast. This was done using monthly Met Office data from January 1959 — July 2020 (contains public sector information licensed under the Open Government Licence v1.0).
在最后一个示例中,苏格兰Braemar的平均最低最低气温值用于训练和验证ARIMA模型预测。 这是使用1959年1月至2020年7月的大都会办公室每月数据 (包含根据《公开政府许可证v1.0》 许可的公共部门信息)完成的。
In this instance, a Monte Carlo simulation is built on the same data in an attempt to generate a scenario analysis of a range of temperature values.
在这种情况下,基于相同的数据进行蒙特卡洛模拟,以尝试生成一系列温度值的方案分析。
Firstly, let’s take a closer look at the data itself.
首先,让我们仔细看看数据本身。
This is the mean monthly minimum temperature for Braemar:
这是Braemar的平均每月最低温度:

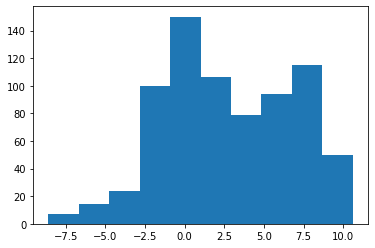
Let’s analyse the time series in more detail. Firstly, let’s plot a histogram of the distribution:
让我们更详细地分析时间序列。 首先,让我们绘制分布的直方图:

From looking at the histogram, we can see that the distribution shows negative skew. Let’s calculate this to confirm.
通过查看直方图,我们可以看到分布显示为负偏斜。 让我们计算一下以确认。
>>> series = value;
>>> skewness = series.skew();
>>> print("Skewness:");
>>> print(round(skewness,2));Skewness:
-0.05
From this analysis, we observe that the distribution is negatively skewed, and therefore doesn’t necessarily follow a normal distribution (at least not fully).
通过此分析,我们观察到分布呈负偏斜,因此不一定遵循正态分布(至少不完全呈正态分布)。
Here is a QQ plot of the residuals:
这是残差的QQ图:

In particular, we can see that values in the upper quantiles deviate from the normal distribution line. With a median temperature of 2.2°C and a mean temperature of 2.72°C (Braemar is one of the coldest areas of the United Kingdom), values significantly above this lie outside the bounds of a normal distribution — we would expect that with lower temperatures recorded in the upper quantiles — the distribution would assume a more normally-shaped pattern.
特别是,我们可以看到较高分位数中的值偏离了正态分布线。 平均温度为2.2°C,平均温度为2.72°C(宝马山是英国最冷的地区之一),高于此值的值不在正态分布范围内-我们希望温度较低时记录在较高的分位数中-分布将呈现更正常的形状。
Additionally, modelling weather patterns can be quite tricky as the distribution will vary based on geography. For instance, temperature distribution at the equator will be quite different to that of the poles. In this regard, understanding the distribution of the time series in question is necessary in order to model weather simulations accurately.
此外,对天气模式进行建模可能会非常棘手,因为分布会根据地理位置而变化。 例如,赤道的温度分布将与两极的温度分布完全不同。 在这方面,有必要了解有关时间序列的分布,以便准确地模拟天气模拟。
蒙特卡罗模拟 (Monte Carlo Simulation)
For this simulation, 1000 random values are generated. Since the distribution has been identified as negatively skewed, this means that the generated random values must also follow a similar negatively skewed distribution.
对于此仿真,将生成1000个随机值。 由于已将分布标识为负偏斜,因此这意味着生成的随机值也必须遵循类似的负偏斜分布。
预测每月最低温度 (Forecasting Monthly Temperature Minimums)
To do this, skewnorm from the scipy library can be used. As was previously indicated, a (or the skew parameter) is set to -0.05.
为此, skewnorm 可以从scipy库中使用。 如前所述,a(或偏斜参数)设置为-0.05 。
from scipy.stats import skewnorm
a=-0.05
distribution = skewnorm.rvs(a, size=1000)
Here is a sample of the generated array:
这是生成的数组的示例:
array([ 1.10993586e-01,  1.92293755e+00, -1.29797928e+00, -1.36817895e+00,
       -4.08836917e-01, -2.20566871e-01, -1.80936352e+00,
...
-1.59656083e-01,  2.10239315e+00,  1.98068918e-01, -2.23784665e-01])
Here is a plot of the generated data, which shows a very slight negative skew:
这是生成的数据图,显示了非常轻微的负偏斜:

The mean and standard deviation for the original series is calculated:
计算原始序列的均值和标准差:
>>> mu=np.mean(value)
>>> mu
2.7231393775372124>>> sigma=np.std(value)
>>> sigma
4.082818933287181
Now, the generated random numbers that form the assumed distribution are multiplied by sigma (standard deviation), with the product then added to mu (the mean).
现在,将形成假定分布的生成的随机数乘以sigma(标准差),然后将乘积加到mu(平均值)上。
y = mu + sigma*distribution
num_bins = 50
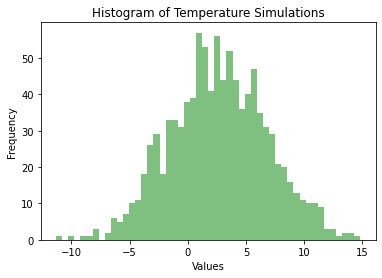
Here is another example of this procedure (with a normal distribution being assumed). Let’s generate a histogram of the temperature simulations:
这是此过程的另一个示例 (假设正态分布)。 让我们生成温度模拟的直方图:
# Histogram
plt.hist(y, num_bins, facecolor='green', alpha=0.5)
plt.xlabel('Values')
plt.ylabel('Frequency')
plt.title(r'Histogram of Temperature Simulations')
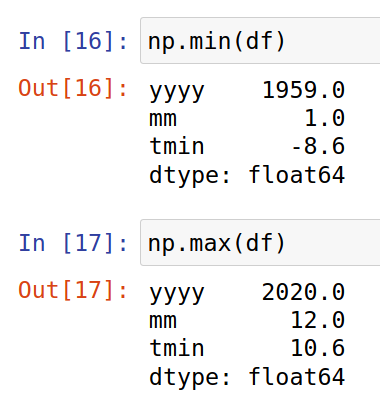
You will notice that the lowest simulated temperature of -11.32°C lies just below the lowest mean monthly temperature value of -8.6°C as recorded in the original data. From that standpoint, the model did reasonably well in estimating the extreme minimum values that could be expected on a monthly basis.
您会注意到,最低模拟温度-11.32°C恰好低于原始数据中记录的最低平均每月温度值-8.6°C。 从这个角度来看,该模型在估计每月可能期望的极小最小值方面表现相当不错。

预测每日最低温度 (Forecasting Daily Temperature Minimums)
That said, a limitation in this example is that we are working with monthly data — not daily.
就是说,此示例中的局限性在于我们正在使用每月数据,而不是每天。
Suppose we wished to predict the lowest daily minimum temperature instead. Would this model be of use in this scenario?
假设我们希望预测最低的每日最低温度。 此模型在这种情况下会有用吗?
In fact, the lowest recorded daily minimum temperature for Braemar came in at -27.2°C on 10 January 1982, which greatly exceeds the lowest simulated temperature of -11.32°C by the Monte Carlo model.
实际上,1982年1月10日, 宝马汽车的最低记录每日最低温度为-27.2°C,大大超过了蒙特卡洛模型的最低模拟温度-11.32°C。
This indicates that the distribution may be more negatively skewed than the monthly data suggests. Use of daily data might show greater negative skew, and may be more informative for the Monte Carlo simulation.
这表明该分布可能比月度数据显示的负偏斜更大。 每日数据的使用可能显示更大的负偏斜,并且对于蒙特卡洛模拟可能更有用。
Let’s lower a (our skew parameter) down to -2 and see what happens.
让我们将 (我们的偏斜参数)降低到-2,看看会发生什么。

A minimum mean monthly temperature of -12.34°C is recorded. This is still much higher than the minimum daily temperature recorded.
记录的最低平均每月温度为-12.34°C。 这仍然远高于记录的最低每日温度。
In this regard, while a Monte Carlo simulation was useful for modelling monthly data — such a simulation still cannot compensate for a scenario where we do not have the data we want.
在这方面,虽然蒙特卡洛模拟对于建模月度数据很有用,但这种模拟仍无法弥补我们没有所需数据的情况。
The likelihood is that taking daily temperature data for Braemar would mean a much more negatively skewed distribution. That said, the mean and standard deviation of that series would also likely vary significantly — without knowledge of these parameters then the Monte Carlo Simulation is limited in terms of being able to estimate daily values.
可能是,获取Braemar的每日温度数据将意味着分布出现更大的负偏斜。 就是说,该系列的平均值和标准偏差也可能会发生很大变化-如果不了解这些参数,则蒙特卡洛模拟在能够估计每日值方面受到限制。
A Monte Carlo simulation can be strong when we have the right data — but it does not necessarily make up for a lack of data.
当我们拥有正确的数据时,蒙特卡洛模拟可能会很强大,但不一定能弥补数据的不足。
结论 (Conclusion)
This has been an introduction to how a Monte Carlo simulation can be used to model extreme weather events.
这是对如何使用蒙特卡洛模拟法对极端天气事件进行建模的介绍。
In particular, we saw:
特别是,我们看到了:
- The importance of identifying the correct distribution for the time series in question 确定有关时间序列的正确分布的重要性
Use of skewnorm in scipy for generating random numbers with a defined skew
在scipy中使用skewnorm生成具有定义的偏斜的随机数
- Implementation of a Monte Carlo simulation for identifying extreme potential values 实施蒙特卡罗模拟以识别极高的潜在价值
Many thanks for your time, and any questions or feedback are greatly appreciated. You can find the GitHub repository for this example here.
非常感谢您的宝贵时间,任何问题或反馈都将不胜感激。 您可以在此处找到此示例的GitHub存储库。
Disclaimer: This article is written on an “as is” basis and without warranty. It was written with the intention of providing an overview of data science concepts, and should not be interpreted as professional advice in any way. The findings and interpretations in this article are those of the author and are not endorsed by or affiliated with the UK Met Office in any way.
免责声明:本文按“原样”撰写,不作任何担保。 它旨在提供数据科学概念的概述,并且不应以任何方式解释为专业建议。 本文中的发现和解释仅归作者所有,并不以任何方式得到英国气象局的认可或附属。
翻译自: https://towardsdatascience.com/using-a-monte-carlo-simulation-to-forecast-extreme-weather-events-d17671149d3e
蒙特卡洛模拟预测股票
本文来自互联网用户投稿,该文观点仅代表作者本人,不代表本站立场。本站仅提供信息存储空间服务,不拥有所有权,不承担相关法律责任。如若转载,请注明出处:http://www.mzph.cn/news/389319.shtml
如若内容造成侵权/违法违规/事实不符,请联系多彩编程网进行投诉反馈email:809451989@qq.com,一经查实,立即删除!


思想及实现)


