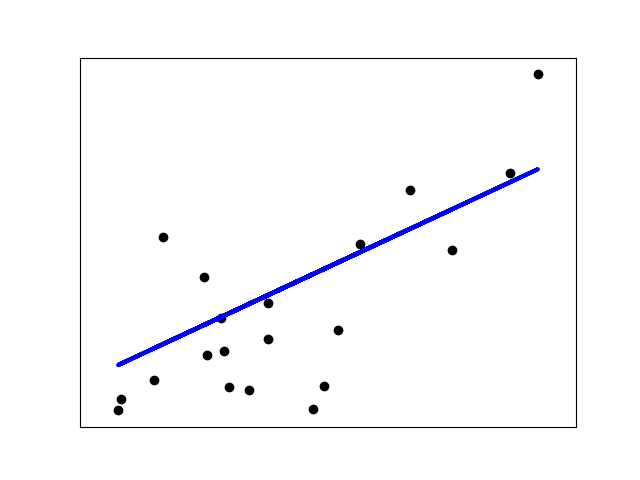
先从最简单的例子开始,假设我们有一组样本(如下图的一个个黑色的圆点),只有一个特征,如下图,横轴是特征值,纵轴是label。比如横轴是房屋面积,纵轴是房屋价格.

现在我们要做什么呢?我们试图找到一条直线y=ax+b,可以尽量好的拟合这些点.
你可能要问了,为啥是直线,不是曲线,不是折线?因为我们的前提就是我们假设数据是有线性关系的啊!一方面,这种假设方便我们用数学知识推导出a,b. 另一方面,假设成折线,曲线尽可能地贴合上图中的点是没有意义的,因为尽可能地贴合了训练数据,只能说明你的模型过拟合了,我们想要得到的是一个尽量通用的模型,能够在我们的测试数据上取得好的表现.即希望我们的模型泛化能力足够强.
这里要插一句,每一种机器学习算法都可以看做是一种看待数据的角度,线性回归就是从"数据可能存在线性关系"这个角度来观察数据. 你当然也可以从别的角度观察数据.这就涉及到了集成学习,可以看看这篇博文. 所以啊,没有尽量多的数据,尽量有意义的数据,尽量有效的特征提取,只有机器学习算法的话,其实没什么用.因为数据太少了,你再怎么从各种角度分析数据也不会取得很好的效果.这也是为啥大数据和机器学习总是被经常一起提到的原因.
ok,书归正传,到了这里,问题来了,我们怎么评价"尽量好"地拟合呢?
对某个样本点,其本来横坐标上是x,纵坐标是y。 我们把x带入我们的直线方程y=ax+b可以得到$\hat y=ax+b$,此即我们的预测值.我们以这二者之差的大小作为"尽量好"的评价标准.越小说明我们的预测值与真实值差别越小,拟合效果越好.
具体地说,有以下几种评价标准
- 均方误差MSE
- 均方根误差RMSE
- 平均绝对误差MAE
- R Squared
均方误差MSE $$\frac 1 m \sum_{i=1}^m(y^{(i)} - \hat y^{(i)})^2$$
表明了总误差平摊到每一个样本上是多少,即均方误差.
均方根误差RMSE $$\sqrt {\sum_{i=1}^m(y^{i} - \hat y^{i})^2}$$
MSE的一个问题是,假如y是有量纲的,MSE的结果把量纲改变了.比如y的单位是dollar,MSE的结果变成了$dollar^2$。RSME就避免了这个问题.
平均绝对误差MAE$$\frac 1 m \sum _{i=1}^m |y^{(i)} - \hat y^{(i)}|$$
我们为啥不用这个作为我们评判“尽可能好”的标准呢,因为不好求导.
R Squared $$R^2 = 1 - \frac {\sum _{i=1}^m(\hat y^{(i)} - y^{(i)})^2} {\sum _{i=1}^m(\bar y - y^{(i)})^2}$$
假设我们简单的取y的均值,即$y=\bar y$作为我们的模型,那误差就是$\sum_{i=1}^m(\bar y - y^{i})^2$。所以$R^2$表达的就是我们的模型相较于简单的取$\bar y$作为我们的模型有多少差异.
当$R^2$接近0时,说明我们的模型和直接取均值差别不大
当$R^2$接近1时,说明我们的模型相当不错,我们预测值和真实值几乎没误差.
当$R^2$为负时,说明我们的模型比直接取均值还要烂.此时你的数据可能就不存在线性关系.
比较常用的是RMSE和R平方.
现在问题变成了我们怎么求出a,b使得$ {\sum _{i=1}^m(\hat y^{(i)} - y^{(i)})^2} = {\sum _{i=1}^m(ax^{i}+b - y^{(i)})^2} $最小.这个函数就是所谓的损失函数.注意这个函数的未知数是a,b。这是很多机器学习算法的一个套路,首先定义出一个合适的损失函数,然后最小化损失函数从而得出我们的模型.
以上,我们是用一个特征做例子的,实际上,当样本有N个特征,道理也是一样的。
$y = a_1x_1+a_2x_2+…+a_nx_n+b$
那么第i个样本的预测值为$y^i = a_1x_1^i+a_2x_2+…+a_nx_n+b$我们改写成向量的形势就是
$$\hat y^{(i)} = \begin{bmatrix} 1& X_1^{(i)}&X_2^{(i)}& … &X_n^{(i)}\end{bmatrix}\begin{bmatrix} \theta_ 0 \\ \theta_ 1 \\ \theta_ 2 \\ … \\ \theta_ n \\ \end{bmatrix}$$
令$X_b=\left[ \begin{matrix} 1 & x_{11} & x_{12} & ... & x_{1n} \\ 1 & x_{21} & x_{22} & ... & x_{2n} \\ ...\\ 1 & x_{m1} & x_{m2} & ... & x_{mn} \end{matrix} \right] $
则$\hat y^{i} = X_b^{(i)}\theta$,$\hat y^ = X_b\theta$,此时我们的损失函数变为$f_{loss} = \sum_{i=1}^m(y^i - X_b^i \theta)^2$
转换成矩阵的表达$f_{loss} = (y-X_b\theta)^T(y - X_b\theta)$。现在我们的目标变为使这个$f_{loss}$最小,注意未知数是$\theta$。注意一下这个$\theta$是个向量,是一系列值,不是标量.在二维平面中比如$y=f(x)$中,我们知道求极值即求导数$f^{'}(x)=0$.同样的为了求出$f_{loss}$的最小值,我们对$f_{loss}$求导$\frac {\partial f_{loss}}{\partial \theta}$,实际上就是对$\theta$的每一项求偏导数.一系列复杂的数学推导后,我们可得$$\theta=(X_b^TX_b)^{-1}X_b^Ty$$
$\theta=\begin{bmatrix} \theta_ 0\\ \theta_ 1\\ \theta_ 2\\ …\\ \theta_ n\\ \end{bmatrix}$
其中$\theta_0$是多元线性方程的截距(intercept), $\theta_1$到$\theta_n$是系数(coefficients).
线性回归具有很好的可解释性,下面通过一个具体例子看一下.
Boston House Prices dataset
===========================Notes
------
Data Set Characteristics:  :Number of Instances: 506 :Number of Attributes: 13 numeric/categorical predictive:Median Value (attribute 14) is usually the target:Attribute Information (in order):- CRIM     per capita crime rate by town- ZN       proportion of residential land zoned for lots over 25,000 sq.ft.- INDUS    proportion of non-retail business acres per town- CHAS     Charles River dummy variable (= 1 if tract bounds river; 0 otherwise)- NOX      nitric oxides concentration (parts per 10 million)- RM       average number of rooms per dwelling- AGE      proportion of owner-occupied units built prior to 1940- DIS      weighted distances to five Boston employment centres- RAD      index of accessibility to radial highways- TAX      full-value property-tax rate per $10,000- PTRATIO  pupil-teacher ratio by town- B        1000(Bk - 0.63)^2 where Bk is the proportion of blacks by town- LSTAT    % lower status of the population- MEDV     Median value of owner-occupied homes in $1000's:Missing Attribute Values: None:Creator: Harrison, D. and Rubinfeld, D.L.This is a copy of UCI ML housing dataset.
http://archive.ics.uci.edu/ml/datasets/HousingThis dataset was taken from the StatLib library which is maintained at Carnegie Mellon University.The Boston house-price data of Harrison, D. and Rubinfeld, D.L. 'Hedonic
prices and the demand for clean air', J. Environ. Economics & Management,
vol.5, 81-102, 1978.   Used in Belsley, Kuh & Welsch, 'Regression diagnostics
...', Wiley, 1980.   N.B. Various transformations are used in the table on
pages 244-261 of the latter.The Boston house-price data has been used in many machine learning papers that address regression
problems.   **References**- Belsley, Kuh & Welsch, 'Regression diagnostics: Identifying Influential Data and Sources of Collinearity', Wiley, 1980. 244-261.- Quinlan,R. (1993). Combining Instance-Based and Model-Based Learning. In Proceedings on the Tenth International Conference of Machine Learning, 236-243, University of Massachusetts, Amherst. Morgan Kaufmann.- many more! (see http://archive.ics.uci.edu/ml/datasets/Housing)
boston数据集有13个特征,包括了房间数目,房龄,是否临河,离商圈距离等等,一个label,表示房屋价格.
用sklearn中的LinearRegression来做训练.
boston = datasets.load_boston()
X = boston.data
y = boston.target
X = X[y < 50.0]
y = y[y < 50.0]from sklearn.linear_model import LinearRegression lin_reg = LinearRegression() lin_reg.fit(X, y) print(lin_reg.coef_)
####
array([ -1.05574295e-01, 3.52748549e-02, -4.35179251e-02,
4.55405227e-01, -1.24268073e+01, 3.75411229e+00,-2.36116881e-02, -1.21088069e+00, 2.50740082e-01,-1.37702943e-02, -8.38888137e-01, 7.93577159e-03,-3.50952134e-01]
print(boston.feature_names[np.argsort(lin_reg.coef_)])
####
array(['NOX', 'DIS', 'PTRATIO', 'LSTAT', 'CRIM', 'INDUS', 'AGE', 'TAX',
       'B', 'ZN', 'RAD', 'CHAS', 'RM'], dtype='<U7')
coef系数越大越正相关,越小越负相关.上面例子里可以看出,特征'NOX'最不想干,特征'RM'最相关.
有关LinearRegression更多的详细解释和用法请戳官方文档.


![[数学]点、线、面分割问题](http://pic.xiahunao.cn/[数学]点、线、面分割问题)


![第二章:09流程控制[3for]](http://pic.xiahunao.cn/第二章:09流程控制[3for])


