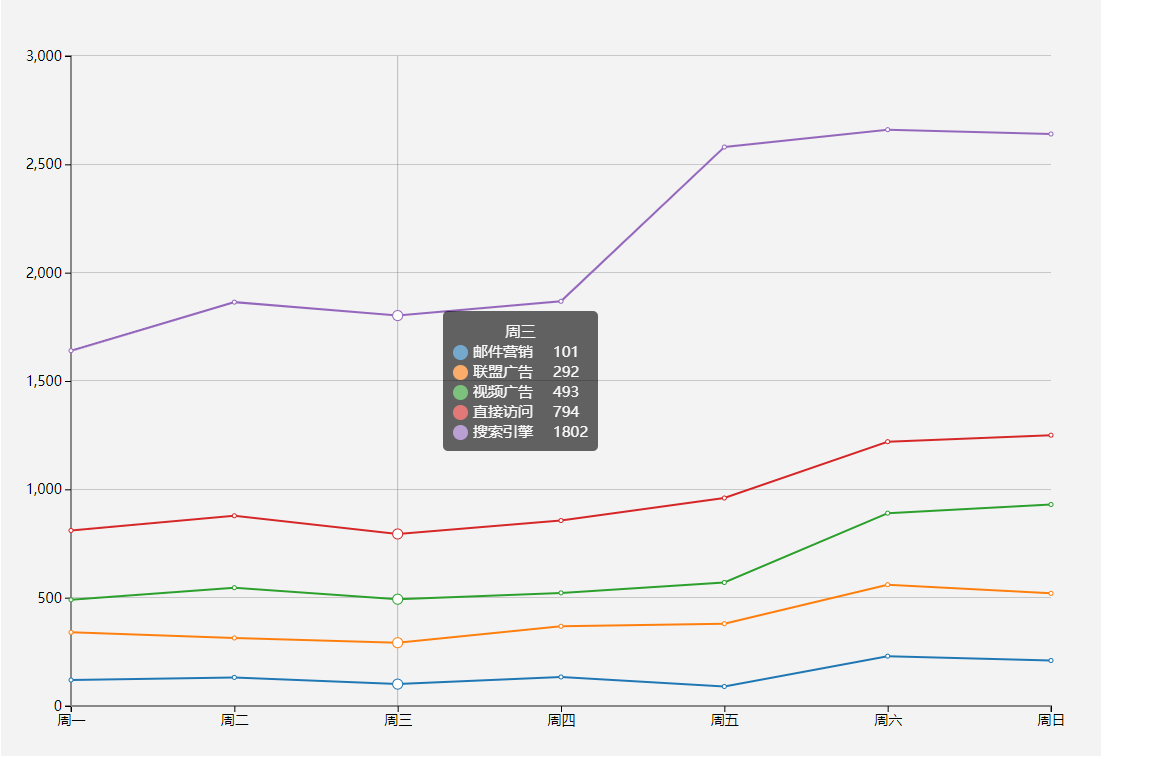
今天我们来仿echarts折线图,这个图在echarts是折线图堆叠,但是我用d3改造成了普通的折线图,只为了大家学习(其实在简单的写一个布局就可以)。废话不多说商行代码。
1 制作 Line 类
class Line {constructor() {this._width = 1100;this._height = 800;this._padding = 10;this._offset = 35;this._margins = {right: 50,bottom: 50,left: 70,top: 100};this._scaleX = d3.scaleBand().range([0, this.quadrantWidth()]).paddingInner(1).align(0);this._scaleY = d3.scaleLinear().range([this.quadrantHeight(), 0]);this._color = d3.scaleOrdinal(d3.schemeCategory10);this._dataX = [];this._series = [];this._svg = null;this._body = null;this._tooltip = null;this._transLine = null;this._activeR = 5;this._ticks = 5;}render() {if(!this._tooltip) {this._tooltip = d3.select('body').append('div').style('left', '40px').style('top', '30px').attr('class', 'tooltip').html('');}if(!this._svg) {this._svg = d3.select('body').append('svg').attr('width', this._width).attr('height', this._height).style('background', '#f3f3f3')this.renderAxes();this.renderClipPath();}this.renderBody();}renderAxes() {let axes = this._svg.append('g').attr('class', 'axes');this.renderXAxis(axes);this.renderYAxis(axes);}renderXAxis(axes) {let xAxis = d3.axisBottom().scale(this._scaleX).ticks(this._dataX.length);axes.append('g').attr('class', 'x axis').attr('transform', `translate(${this.xStart()}, ${this.yStart()})`).call(xAxis)d3.selectAll('g.x .tick text').data(this._dataX).enter()}renderYAxis(axes) {let yAxis = d3.axisLeft().scale(this._scaleY).ticks(this._ticks);axes.append('g').attr('class', 'y axis').attr('transform', `translate(${this.xStart()}, ${this.yEnd()})`).call(yAxis)d3.selectAll('.y .tick').append('line').attr('class', 'grid-line').attr('x1', 0).attr('y1', 0).attr('x2', this.quadrantWidth()).attr('y2', 0)}renderClipPath() {this._svg.append('defs').append('clipPath').attr('id', 'body-clip').append('rect').attr('x', 0 - this._activeR - 1).attr('y', 0).attr('width', this.quadrantWidth() + (this._activeR + 1) * 2).attr('height', this.quadrantHeight())}renderBody() {if(!this._body) {this._body = this._svg.append('g').attr('class', 'body').attr('transform', `translate(${this._margins.left},${this._margins.top})`).attr('clip-path', 'url(#body-clip)')this.renderTransLine()}this.renderLines();this.renderDots();this.listenMousemove();}renderTransLine() {this._transLine = this._body.append('line').attr('class', 'trans-line').attr('x1', 0).attr('y1', 0).attr('x2', 0).attr('y2', this._scaleY(0)).attr('stroke-opacity', 0)}renderLines() {let line = d3.line().x((d,i) => this._scaleX(this._dataX[i])).y(d => this._scaleY(d))let lineElements = this._body.selectAll('path.line').data(this._series);let lineEnter =  lineElements.enter().append('path').attr('class', 'line').attr('d', d => line(d.data.map(v => 0))).attr('stroke', (d,i) => this._color(i))let lineUpdate = lineEnter.merge(lineElements).transition().duration(100).ease(d3.easeCubicOut).attr('d', d => line(d.data))let lineExit = lineElements.exit().transition().attr('d', d => line(d.data)).remove();}renderDots() {this._series.forEach((d,i) => {let dotElements = this._body.selectAll('circle._' + i).data(d.data);let dotEnter =  dotElements.enter().append('circle').attr('class', (v, index) => 'dot _' + i + ' index_' + index).attr('cx', (d,i) => this._scaleX(this._dataX[i])).attr('cy', d => this._scaleY(d)).attr('r', 1e-6).attr('stroke', (d,i) => this._color(i))let dotUpdate = dotEnter.merge(dotElements).transition().duration(100).ease(d3.easeCubicOut).attr('cx', (d,i) => this._scaleX(this._dataX[i])).attr('cy', d => this._scaleY(d)).attr('r', 2)let dotExit = dotElements.exit().transition().attr('r', 0).remove();})this._dataX.forEach((d,i) => {d3.selectAll('circle._' + i).attr('stroke', this._color(i))})}listenMousemove() {this._svg.on('mousemove', () => {let px = d3.event.offsetX;let py = d3.event.offsetY;if(px < this.xEnd() && px > this.xStart() && py < this.yStart() && py > this.yEnd()) {this.renderTransLineAndTooltip(px, py, px - this.xStart());} else {this.hideTransLineAndTooltip();}})}renderTransLineAndTooltip(x, y, bodyX) {//鼠标悬浮的indexlet cutIndex = Math.floor((bodyX + this.everyWidth() / 2) / this.everyWidth());//提示线位置this._transLine.transition().duration(50).ease(d3.easeLinear).attr('x1', cutIndex * this.everyWidth()).attr('x2', cutIndex * this.everyWidth()).attr('stroke-opacity', 1);// dot圆圈动画d3.selectAll('circle.dot').transition().duration(100).ease(d3.easeCubicOut).attr('r', 2)d3.selectAll('circle.index_' + cutIndex).transition().duration(100).ease(d3.easeBounceOut).attr('r', this._activeR)//提示框位置和内容if(x > this.quadrantWidth() - this._tooltip.style('width').slice(0,-2) - this._padding * 2) {x = x - this._tooltip.style('width').slice(0,-2) - this._padding * 2 - this._offset * 2;}if(y > this.quadrantHeight() - this._tooltip.style('height').slice(0,-2) - this._padding * 2) {y = y - this._tooltip.style('height').slice(0,-2) - this._padding * 2 - this._offset * 2;}let str = `<div style="text-align: center">${this._dataX[cutIndex]}</div>`;this._series.forEach((d, i) => {str = str + `<div style="width: 15px;height: 15px;vertical-align: middle;margin-right: 5px;border-radius: 50%;display: inline-block;background: ${this._color(i)};"></div>${d.name}<span style="display: inline-block;margin-left: 20px">${d['data'][cutIndex]}</span><br/>`
        })this._tooltip.html(str).transition().duration(100).ease(d3.easeLinear).style('display', 'inline-block').style('opacity', .6).style('left', `${x + this._offset + this._padding}px`).style('top', `${y + this._offset + this._padding}px`);}hideTransLineAndTooltip() {this._transLine.transition().duration(50).ease(d3.easeLinear).attr('stroke-opacity', 0);d3.selectAll('circle.dot').transition().duration(100).ease(d3.easeCubicOut).attr('r', 2);this._tooltip.transition().duration(100).style('opacity', 0).on('end', function () {d3.select(this).style('display', 'none')});}everyWidth() {return this.quadrantWidth() / (this._dataX.length - 1);}quadrantWidth() {return this._width - this._margins.left - this._margins.right;}quadrantHeight() {return this._height - this._margins.top - this._margins.bottom;}xStart() {return this._margins.left;}xEnd() {return this._width - this._margins.right;}yStart() {return this._height - this._margins.bottom;}yEnd() {return this._margins.top;}scaleX(a) {this._scaleX = this._scaleX.domain(a);}scaleY(a) {this._scaleY = this._scaleY.domain(a)}selectMaxYNumber(arr) {let temp = [];arr.forEach(item => temp.push(...item.data));let max = d3.max(temp);let base = Math.pow(10, Math.floor(max / 4).toString().length - 1);//获取Y轴最大值return Math.floor(max / 4 / base) * 5 * base;}dataX(data) {if(!arguments.length) return this._dataX;this._dataX = data;this.scaleX(this._dataX);return this;}series(series) {if(!arguments.length) return this._series;this._series = series;let maxY = this.selectMaxYNumber(this._series);this.scaleY([0, maxY])return this;}
}
2 css 文件
.domain {stroke-width: 2;fill: none;stroke: #888;shape-rendering: crispEdges;
}
.tick text {font-size: 14px;
}
.grid-line {fill: none;stroke: #888;opacity: .4;shape-rendering: crispEdges;
}
.trans-line {fill: none;stroke: #666;opacity: .4;
}
.line {fill: none;stroke-width: 2;
}
.dot {fill: #fff;
}
.tooltip{font-size: 15px;width: auto;padding: 10px;height: auto;position: absolute;background-color: #000000;opacity: .6;border-radius:5px;color: #ffffff;display: none;
}
3 HTML 文件
<!DOCTYPE html>
<html lang="en">
<head><meta charset="UTF-8"><title>$Title$</title><link rel="stylesheet" type="text/css" href="css/base.css"/><script type="text/javascript" src="js/d3.v4.js"></script><script type="text/javascript" src="js/line.js"></script>
</head>
<body>
<script>var dataX = ['周一', '周二', '周三', '周四', '周五', '周六', '周日'];var series = [{name: '邮件营销', data:[120, 132, 101, 134, 90, 230, 210]},{name: '联盟广告', data:[340, 314, 292, 368, 380, 560, 520]},{name: '视频广告', data:[490, 546, 493, 522, 570, 890, 930]},{name: '直接访问', data:[810, 878, 794, 856, 960, 1220, 1250]},{name: '搜索引擎', data:[1640, 1864, 1802, 1868, 2580, 2660, 2640]}]var line = new Line();line.dataX(dataX).series(series).render()setInterval(() => {series = series.map((d,i) => {return {name: d.name,data: new Array(7).fill(1).map((dd, ii) => {return Math.floor(Math.random() * 200) + i * 200})}})console.log(series);line.dataX(dataX).series(series).render()}, 4000)
</script>
</body>
</html>

想预览和下载demo的朋友可以移步原文
原文地址 http://www.bettersmile.cn


WXSS样式)
)


![[Codeforces702F]T-Shirts——非旋转treap+贪心](http://pic.xiahunao.cn/[Codeforces702F]T-Shirts——非旋转treap+贪心)

)


