大家好,这里是七七,今天带给大家的实例解析。以前也用过几次LSTM模型,但由于原理不是很清楚,因此不能清晰地表达出来,这次用LSTM的时候,去自习研究了原理以及代码,来分享给大家此次经历。
一、简要介绍
由于RNN(循环神经网络)模型的梯度消失现象,会导致RNN模型的失效,因此人们对RNN的隐含层神经元进行改造,便有了LSTM(长度期记忆)模型。
至于对RNN的修改,可参考循环神经网络(RNN)-CSDN博客
本文来重点介绍这次实现过程中的代码
二、代码部分
1、数据预处理
在构建模型之前,需要先收集数据,并将各种数据存储在表格中,并用python代码导入,这部分是基础部分,与建模无关,就不展示具体代码了。
在搜集了数据之后,我们一般会对数据进行划分,分为训练集和测试集,训练集是来训练模型,测试集是用来测试模型的可信程度。
当不同特征数据的数量级差距比较大时,我们可以对数据进行归一化,从而使得不同维度之间的特征在数值上有一定比较性,可以大大提高分类器的准确性。
而要标准化的具体原因,可看这一部分机器学习——回归_机器学习 回归-CSDN博客
下面这段代码是预处理的过程:
- 提取文件数据中的特征数据
- 对数据进行归一化处理
- 划分测试集与训练集
# 数据预处理
feature_cols = df.columns[:4]
target_col = df.columns[4]# 提取特征和目标变量
features = df[feature_cols].values
target = df[target_col].values.reshape(-1, 1)# 将特征和目标变量分别缩放到 0 到 1 之间
scaler_features = MinMaxScaler(feature_range=(0, 1))
scaler_target = MinMaxScaler(feature_range=(0, 1))scaled_features = scaler_features.fit_transform(features)
scaled_target = scaler_target.fit_transform(target)# 划分数据集
X_train, X_test, y_train, y_test = train_test_split(scaled_features, scaled_target, test_size=0.2, random_state=42)
2、添加时间步长
时间步长用于确定模型在观察数据时每次考虑多少个时间点的信息,这里我们设置其为1,并将时间步长加入数据中。
# 定义时间步长
n_steps = 1# 为训练集和测试集添加时间步长
X_train = X_train.reshape((X_train.shape[0], n_steps, X_train.shape[1]))
X_test = X_test.reshape((X_test.shape[0], n_steps, X_test.shape[1]))
3、构建CNN-LSTM模型
这一步就是单纯地设置模型各个层次的参数了。
- 首先创建一个序列,用以之后向里面加入各层
- 然后加入一个卷积层,设置参数:卷积核数量为32,卷积核大小为3,padding方式为’same’,步长为1,激活函数为ReLU,并指定输入数据的形状
- 添加池化层,设置参数:一维最大池化层,池化窗口大小为1
- 添加一个LSTM层,设置参数:设置神经元数量为16,输出完整的序列
- 添加一个LSTM层,设置参数:设置神经元数量为8,只输出最后一个时间步的输出
- 添加一个全连接层,输出维度为1.
- 编译模型,使用均方误差作为损失函数,Adam优化器用于优化模型参数。
model = Sequential()
model.add(Conv1D(filters=32, kernel_size=3, padding='same', strides=1, activation='relu', input_shape=(X_train.shape[1], X_train.shape[2])))
model.add(MaxPooling1D(pool_size=1))
model.add(LSTM(16, return_sequences=True))
model.add(LSTM(8, return_sequences=False))
model.add(Dense(1))
model.compile(loss='mse', optimizer='adam')
4、训练模型
这一步就是用我们上面处理好的数据投入模型,就可以进行训练,很简单,就不解释了
# 训练模型,并保存训练历史
history = model.fit(X_train, y_train, epochs=100, batch_size=4, shuffle=False, validation_data=(X_test, y_test))
至此,模型已经训练好了,下一步就需要先对模型进行检测,查看可信度。
5、模型检测
这里我们用多个检测,保证模型是准确的
5.1、rmse检测
这里我们用RMSE来作为检测指标
首先将训练集和测试集输入模型,得到预测结果。由于我们的模型对数据进行了归一化,因此还要对预测数据和原始数据进行反归一化操作之后,再来计算rmse的值。
# 预测
train_predict = model.predict(X_train)
test_predict = model.predict(X_test)# 反向缩放预测值
train_predict = scaler_target.inverse_transform(train_predict)
y_train = scaler_target.inverse_transform(y_train)
test_predict = scaler_target.inverse_transform(test_predict)
y_test = scaler_target.inverse_transform(y_test)# 计算RMSE
train_score = mean_squared_error(y_train, train_predict, squared=False)
print('Train Score: %.2f RMSE' % (train_score))
print(r2_score(y_train,train_predict) )
test_score = mean_squared_error(y_test, test_predict, squared=False)
print('Test Score: %.2f RMSE' % (test_score))
print(r2_score(y_test,test_predict))
# 绘制图像
plt.figure(1, figsize=(12, 6), dpi=80)
plt.plot(history.history['loss'], label='Train')
plt.plot(history.history['val_loss'], label='Validation')
plt.title('Loss Curve')
plt.xlabel('Epochs')
plt.ylabel('Loss')
plt.legend()
plt.show()
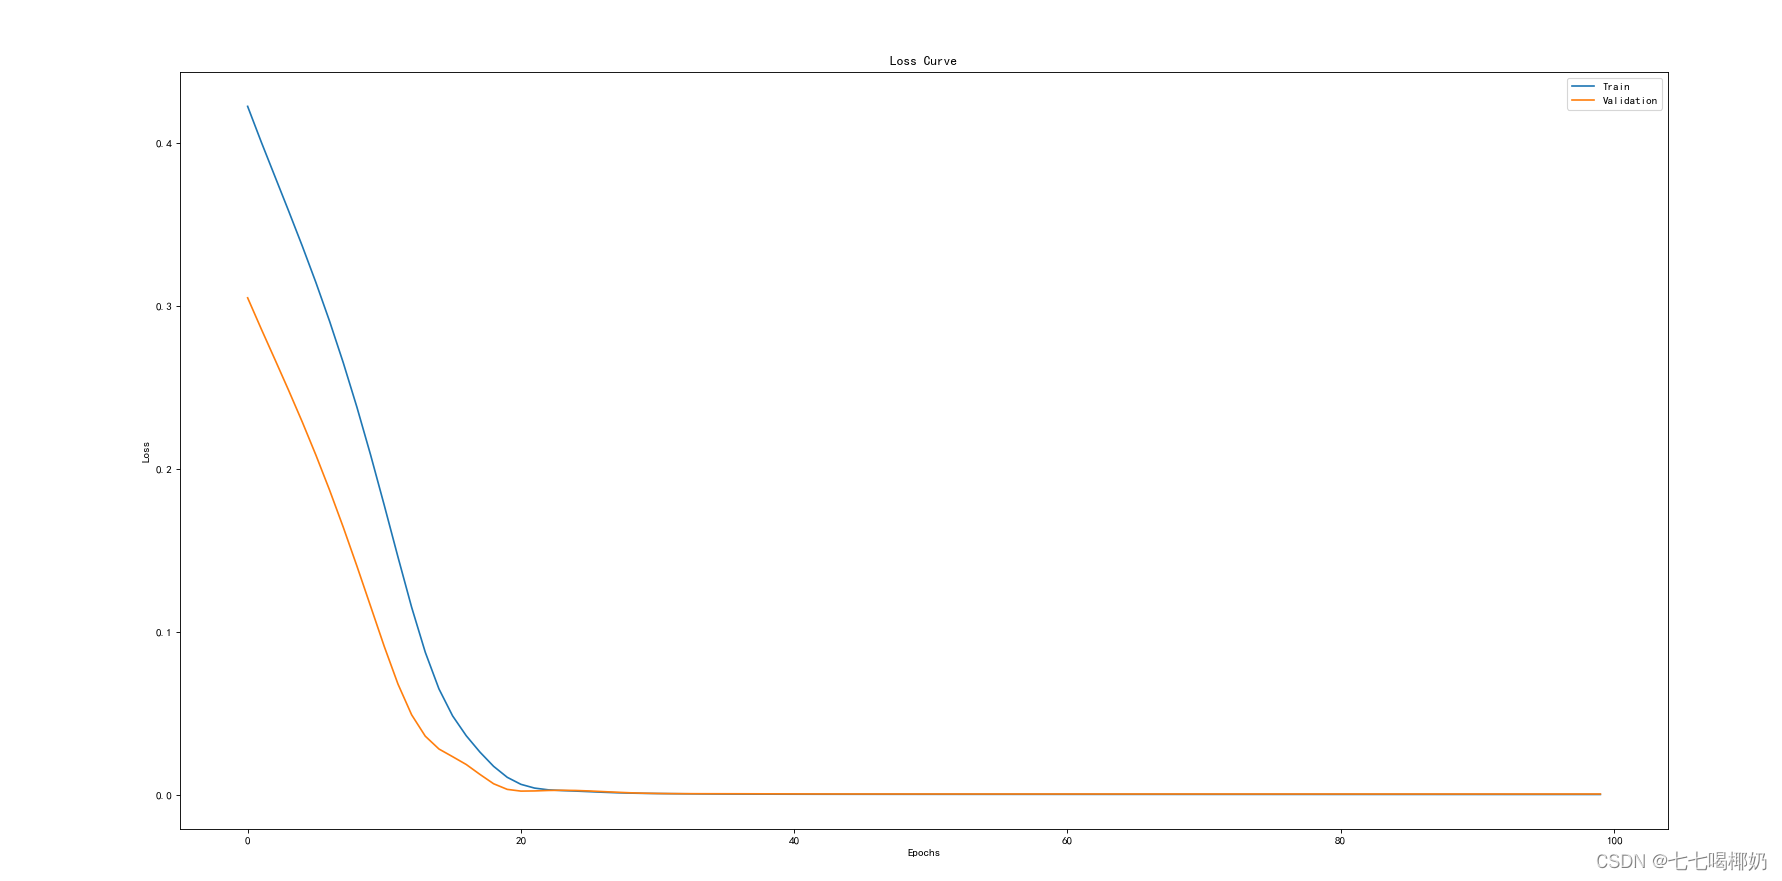
此段代码还输出了rmse的loss图像,代表着训练过程中的损失值的变化。我们这里可以明显看出,损失值明显减小且接近0.
5.2预测数据与原始数据对比
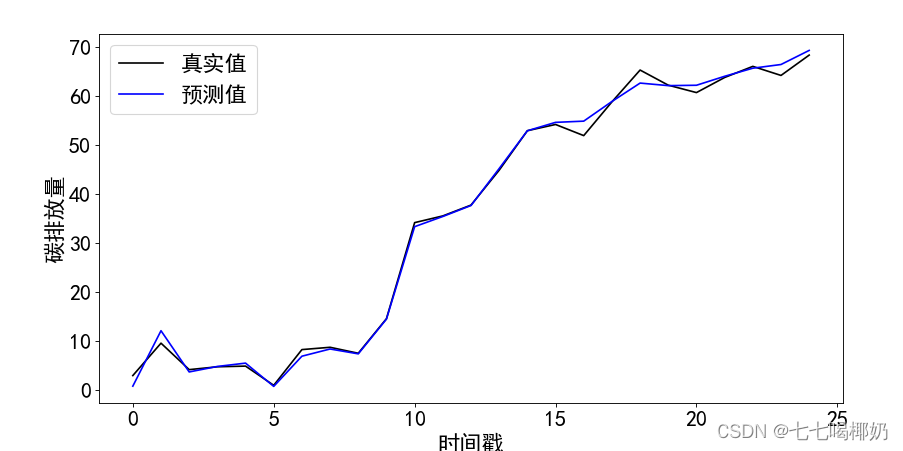
这部分是将原始数据作为输入,得到图像,对比。
# 对特征数据进行缩放
scaled_feature_data = scaler_features.transform(features)# 将数据转换成模型期望的形状
scaled_feature_data = scaled_feature_data.reshape((scaled_feature_data.shape[0], n_steps, scaled_feature_data.shape[1]))# 使用模型进行预测
predicted_output = model.predict(scaled_feature_data)# 反向缩放预测值
predicted_output = scaler_target.inverse_transform(predicted_output)plt.figure(2, figsize=(12, 6), dpi=80)
plt.plot(df.index, target, color='k', label='真实值')  # 使用数据的索引作为横坐标
plt.plot(df.index, predicted_output, color='blue', label='预测值')  # 使用数据的索引作为横坐标
plt.xlabel('时间戳', fontsize=20)
plt.ylabel('碳排放量', fontsize=20)
plt.tick_params(labelsize=20)
plt.legend(fontsize=20)
plt.savefig("真实值和预测值对比.svg", dpi=80, format="svg")
plt.show()

5.3计算MAPE值
这部分就不解释了,单纯的实现了公式
# 计算MAPE
def mean_absolute_percentage_error(y_true, y_pred):y_true, y_pred = np.array(y_true), np.array(y_pred)return np.mean(np.abs((y_true - y_pred) / y_true)) * 100train_mape = mean_absolute_percentage_error(y_train, train_predict)
test_mape = mean_absolute_percentage_error(y_test, test_predict)print('Train MAPE: %.2f' % train_mape)
print('Test MAPE: %.2f' % test_mape)
6、预测
这部分代码是用模型和输入数据,获得预测的输出数据。
prediction_data_path = r'C:\Users\Administrator\Desktop\统计建模\数据\数据集1\cnn-lstm预测得到的数据.xlsx'
prediction_df = pd.read_excel(prediction_data_path)# 提取特征
prediction_features = prediction_df.iloc[:, :4].values# 特征缩放
scaled_prediction_features = scaler_features.transform(prediction_features)# 重塑数据形状
scaled_prediction_features = scaled_prediction_features.reshape((scaled_prediction_features.shape[0], n_steps, scaled_prediction_features.shape[1]))# 进行预测
predictions = model.predict(scaled_prediction_features)# 反向缩放预测结果
unscaled_predictions = scaler_target.inverse_transform(predictions)# 假设你希望将结果保存到一个新的 Excel 文件中
output_path = r'C:\Users\Administrator\Desktop\统计建模\数据\数据集1\预测结果.xlsx'
prediction_df['预测结果'] = unscaled_predictions
prediction_df.to_excel(output_path, index=False)# 或者你也可以直接打印预测结果
print("预测结果:", unscaled_predictions)
三、总代码展示
import pandas as pd
from sklearn.preprocessing import MinMaxScaler
from keras.models import Sequential
from keras.layers import LSTM, Dense
from sklearn.model_selection import train_test_split
from keras.layers import Conv1D, MaxPooling1D
from sklearn.metrics import mean_absolute_error,mean_squared_error,r2_score
import matplotlib.pyplot as plt
import numpy as np
from sklearn.preprocessing import StandardScalerplt.rcParams['font.sans-serif']=[u'simHei']
plt.rcParams['axes.unicode_minus']=False# 读取数据
file_path = r'C:\Users\Administrator\Desktop\统计建模\数据\数据集1\用于sp模型的数据.xlsx'
df = pd.read_excel(file_path)#预测
path =r'C:\Users\Administrator\Desktop\统计建模\数据\数据集1\cnn-lstm预测得到的数据.xlsx'# 数据预处理
feature_cols = df.columns[:4]
target_col = df.columns[4]# 提取特征和目标变量
features = df[feature_cols].values
target = df[target_col].values.reshape(-1, 1)# 将特征和目标变量分别缩放到 0 到 1 之间
scaler_features = MinMaxScaler(feature_range=(0, 1))
scaler_target = MinMaxScaler(feature_range=(0, 1))scaled_features = scaler_features.fit_transform(features)
scaled_target = scaler_target.fit_transform(target)# 划分数据集
X_train, X_test, y_train, y_test = train_test_split(scaled_features, scaled_target, test_size=0.2, random_state=42)# 定义时间步长
n_steps = 1# 为训练集和测试集添加时间步长
X_train = X_train.reshape((X_train.shape[0], n_steps, X_train.shape[1]))
X_test = X_test.reshape((X_test.shape[0], n_steps, X_test.shape[1]))# 搭建CNN-LSTM融合神经网络
model = Sequential()
model.add(Conv1D(filters=32, kernel_size=3, padding='same', strides=1, activation='relu', input_shape=(X_train.shape[1], X_train.shape[2])))
model.add(MaxPooling1D(pool_size=1))
model.add(LSTM(16, return_sequences=True))
model.add(LSTM(8, return_sequences=False))
model.add(Dense(1))
model.compile(loss='mse', optimizer='adam')# 训练模型,并保存训练历史
history = model.fit(X_train, y_train, epochs=100, batch_size=4, shuffle=False, validation_data=(X_test, y_test))prediction_data_path = r'C:\Users\Administrator\Desktop\统计建模\数据\数据集1\cnn-lstm预测得到的数据.xlsx'
prediction_df = pd.read_excel(prediction_data_path)# 提取特征
prediction_features = prediction_df.iloc[:, :4].values# 特征缩放
scaled_prediction_features = scaler_features.transform(prediction_features)# 重塑数据形状
scaled_prediction_features = scaled_prediction_features.reshape((scaled_prediction_features.shape[0], n_steps, scaled_prediction_features.shape[1]))# 进行预测
predictions = model.predict(scaled_prediction_features)# 反向缩放预测结果
unscaled_predictions = scaler_target.inverse_transform(predictions)# 假设你希望将结果保存到一个新的 Excel 文件中
output_path = r'C:\Users\Administrator\Desktop\统计建模\数据\数据集1\预测结果.xlsx'
prediction_df['预测结果'] = unscaled_predictions
prediction_df.to_excel(output_path, index=False)# 或者你也可以直接打印预测结果
print("预测结果:", unscaled_predictions)# 预测
train_predict = model.predict(X_train)
test_predict = model.predict(X_test)# 反向缩放预测值
train_predict = scaler_target.inverse_transform(train_predict)
y_train = scaler_target.inverse_transform(y_train)
test_predict = scaler_target.inverse_transform(test_predict)
y_test = scaler_target.inverse_transform(y_test)# 计算RMSE
train_score = mean_squared_error(y_train, train_predict, squared=False)
print('Train Score: %.2f RMSE' % (train_score))
print(r2_score(y_train,train_predict) )
test_score = mean_squared_error(y_test, test_predict, squared=False)
print('Test Score: %.2f RMSE' % (test_score))
print(r2_score(y_test,test_predict))
# 绘制图像
plt.figure(1, figsize=(12, 6), dpi=80)
plt.plot(history.history['loss'], label='Train')
plt.plot(history.history['val_loss'], label='Validation')
plt.title('Loss Curve')
plt.xlabel('Epochs')
plt.ylabel('Loss')
plt.legend()
plt.show()# 对特征数据进行缩放
scaled_feature_data = scaler_features.transform(features)# 将数据转换成模型期望的形状
scaled_feature_data = scaled_feature_data.reshape((scaled_feature_data.shape[0], n_steps, scaled_feature_data.shape[1]))# 使用模型进行预测
predicted_output = model.predict(scaled_feature_data)# 反向缩放预测值
predicted_output = scaler_target.inverse_transform(predicted_output)plt.figure(2, figsize=(12, 6), dpi=80)
plt.plot(df.index, target, color='k', label='真实值')  # 使用数据的索引作为横坐标
plt.plot(df.index, predicted_output, color='blue', label='预测值')  # 使用数据的索引作为横坐标
plt.xlabel('时间戳', fontsize=20)
plt.ylabel('碳排放量', fontsize=20)
plt.tick_params(labelsize=20)
plt.legend(fontsize=20)
plt.savefig("真实值和预测值对比.svg", dpi=80, format="svg")
plt.show()# 计算MAPE
def mean_absolute_percentage_error(y_true, y_pred):y_true, y_pred = np.array(y_true), np.array(y_pred)return np.mean(np.abs((y_true - y_pred) / y_true)) * 100train_mape = mean_absolute_percentage_error(y_train, train_predict)
test_mape = mean_absolute_percentage_error(y_test, test_predict)print('Train MAPE: %.2f' % train_mape)
print('Test MAPE: %.2f' % test_mape)
# 绘制MAPE图像
plt.figure(figsize=(12, 6), dpi=80)
plt.plot(y_test, label='真实值')
plt.plot(test_predict, label='预测值')
plt.title('MAPE图像')
plt.xlabel('样本编号')
plt.ylabel('碳排放量')
plt.legend()
plt.show()
)


--网站的本地部署)


)
