简介
在 Python 中,有许多用于绘图的库。以下是一些常用的 Python 绘图库及其基本绘图函数的简要介绍:
-
Matplotlib:
matplotlib.pyplot.plot(x, y): 绘制线图。matplotlib.pyplot.scatter(x, y): 绘制散点图。matplotlib.pyplot.bar(x, height): 绘制条形图。matplotlib.pyplot.hist(x, bins): 绘制直方图。matplotlib.pyplot.pie(x, labels): 绘制饼图。matplotlib.pyplot.imshow(data): 显示图像。
-
Seaborn:
seaborn.lineplot(x, y, data): 绘制线图。seaborn.scatterplot(x, y, data): 绘制散点图。seaborn.barplot(x, y, data): 绘制条形图。seaborn.histplot(x, bins, data): 绘制直方图。seaborn.boxplot(x, y, data): 绘制箱线图。
-
Pandas:
DataFrame.plot(kind='line'): 在 Pandas 中,DataFrame 对象有一个内置的plot函数,通过kind参数可以选择绘制的图形类型,如折线图、散点图等。
-
Plotly:
plotly.graph_objects.Figure: 使用 Plotly 的图形对象,可以创建各种交互式图表。plotly.express.scatter(x, y, data): 使用 Express 模块绘制散点图。plotly.express.line(x, y, data): 使用 Express 模块绘制线图。
-
Bokeh:
bokeh.plotting.figure(): 创建 Bokeh 图形。figure.line(x, y): 绘制线图。figure.scatter(x, y): 绘制散点图。figure.vbar(x, top): 绘制垂直条形图。
实例
好的,让我为您提供一些使用常见的 Python 绘图库的案例:
1. Matplotlib:
import matplotlib.pyplot as plt
import numpy as np# 绘制折线图
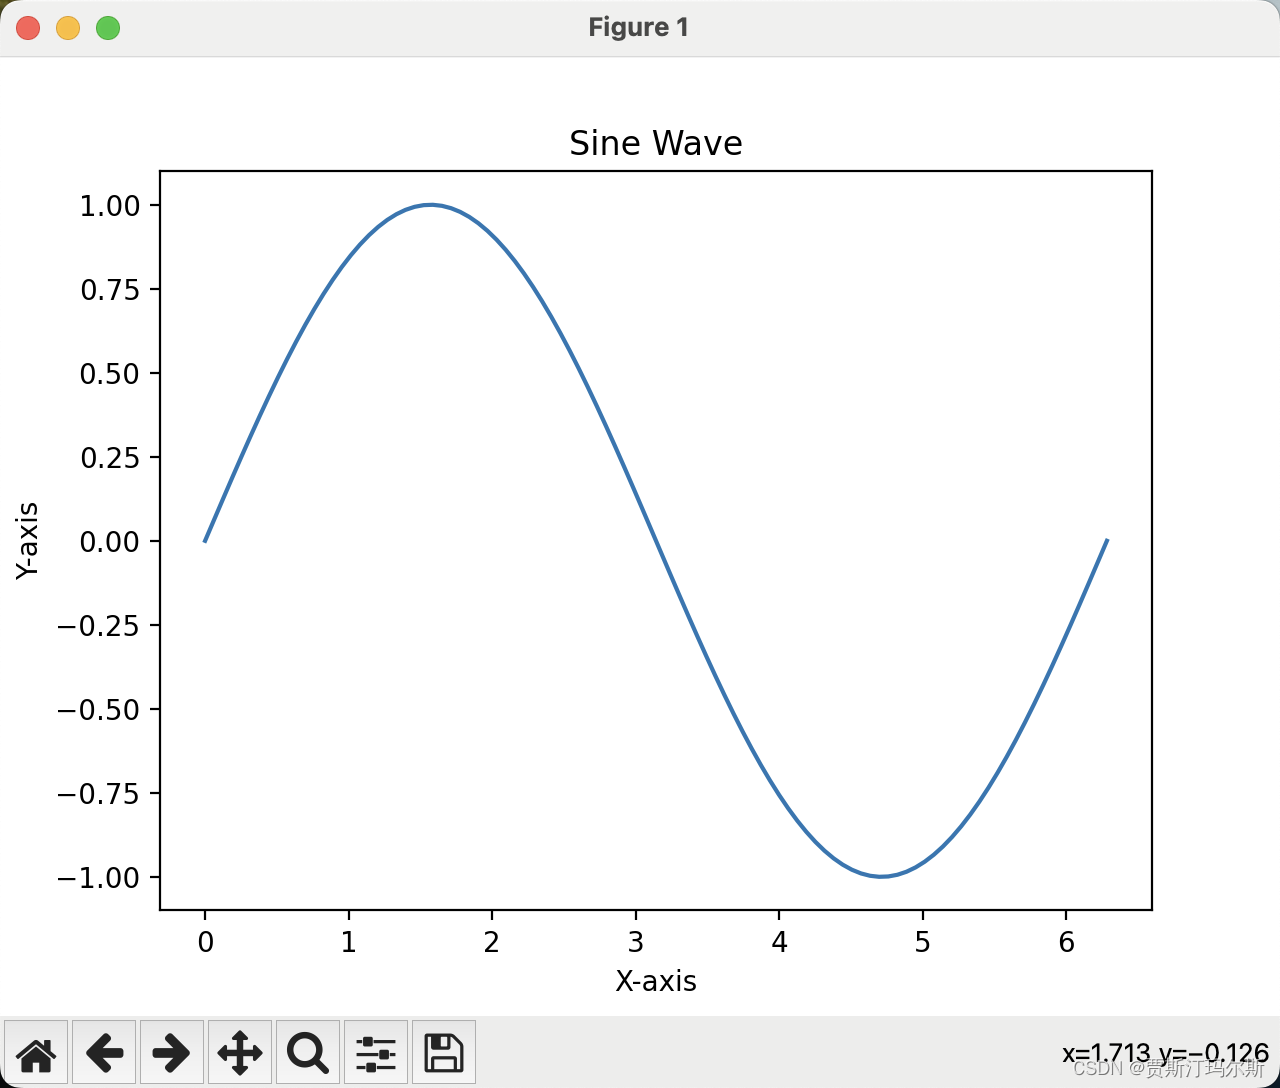
x = np.linspace(0, 2*np.pi, 100)
y = np.sin(x)
plt.plot(x, y)
plt.title('Sine Wave')
plt.xlabel('X-axis')
plt.ylabel('Y-axis')
plt.show()# 绘制散点图
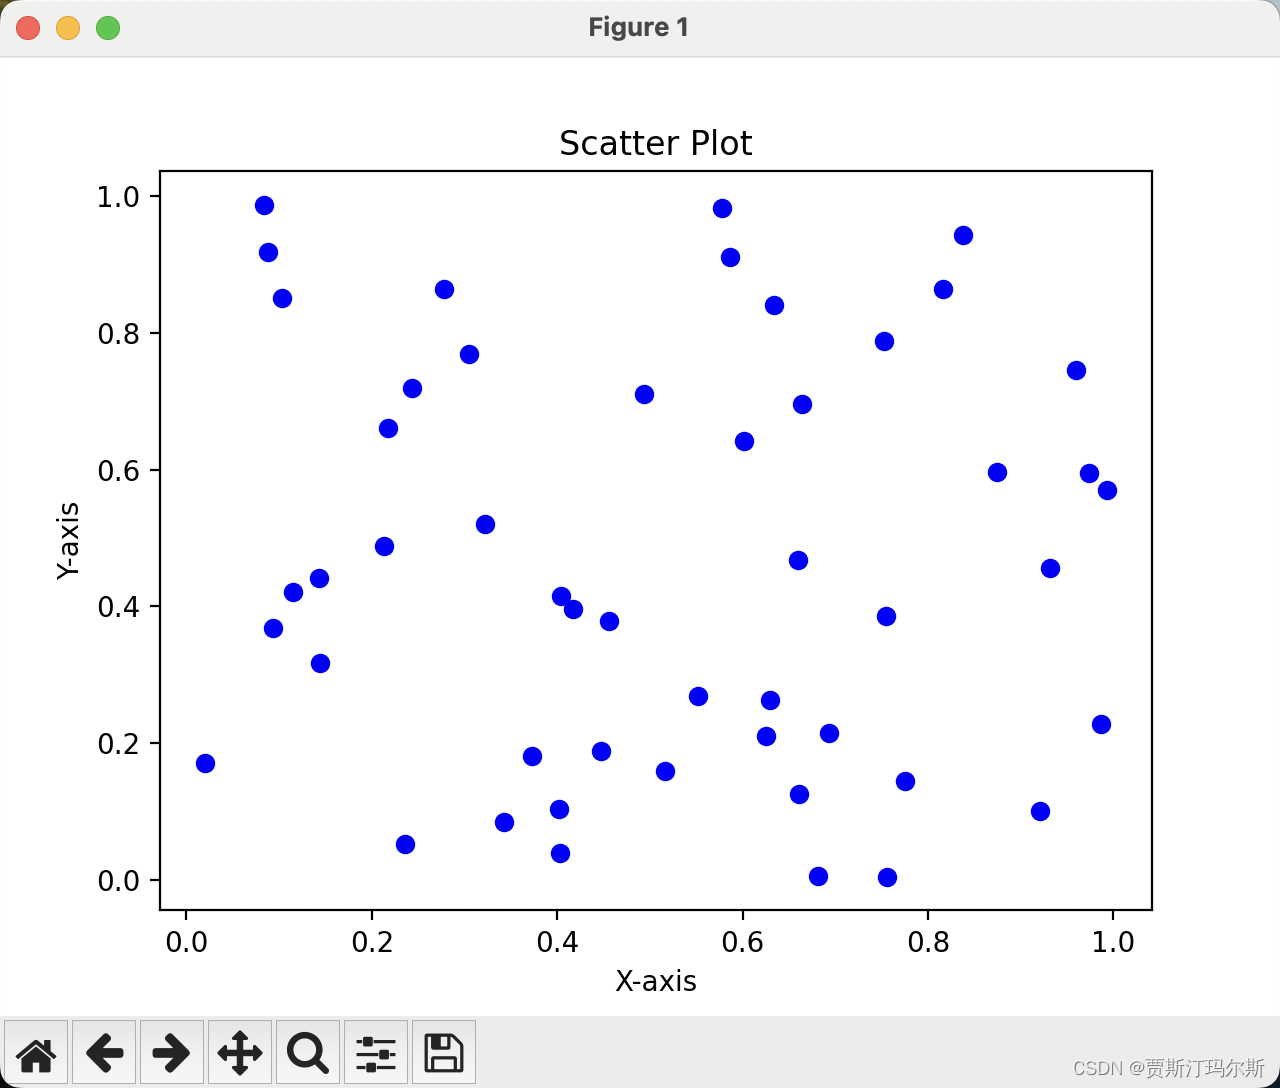
x = np.random.rand(50)
y = np.random.rand(50)
plt.scatter(x, y, color='blue')
plt.title('Scatter Plot')
plt.xlabel('X-axis')
plt.ylabel('Y-axis')
plt.show()
2. Seaborn:
import seaborn as sns
import pandas as pd# 绘制箱线图
data = sns.load_dataset('iris')
sns.boxplot(x='species', y='sepal_length', data=data)
plt.title('Box Plot of Sepal Length by Species')
plt.show()# 绘制直方图
sns.histplot(data['petal_width'], bins=30, kde=True)
plt.title('Histogram of Petal Width')
plt.xlabel('Petal Width')
plt.ylabel('Frequency')
plt.show()
3. Pandas:
import pandas as pd# 创建 DataFrame
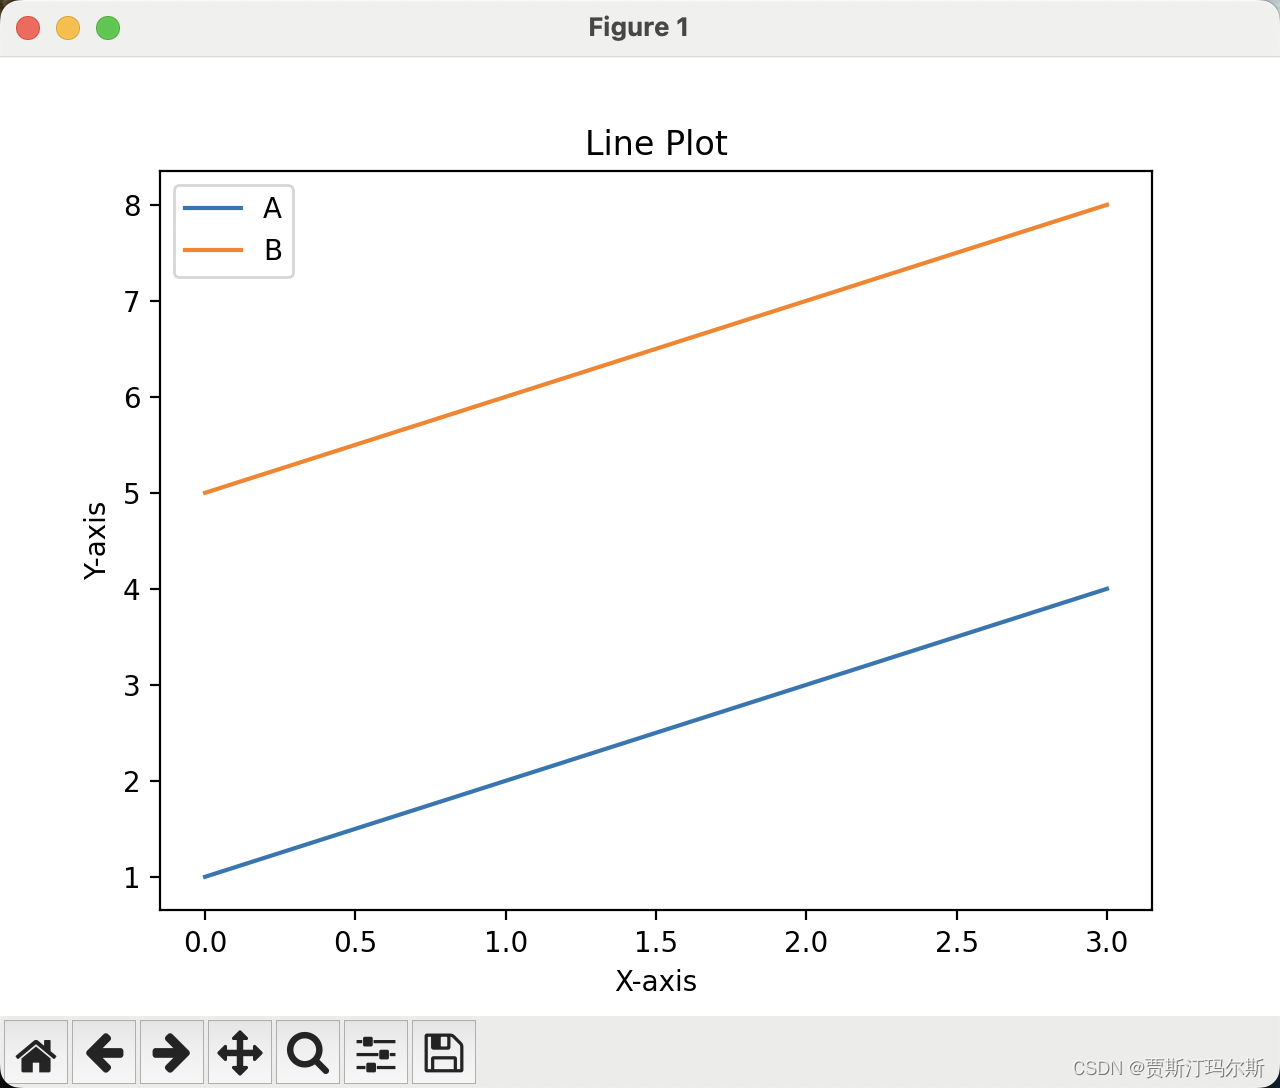
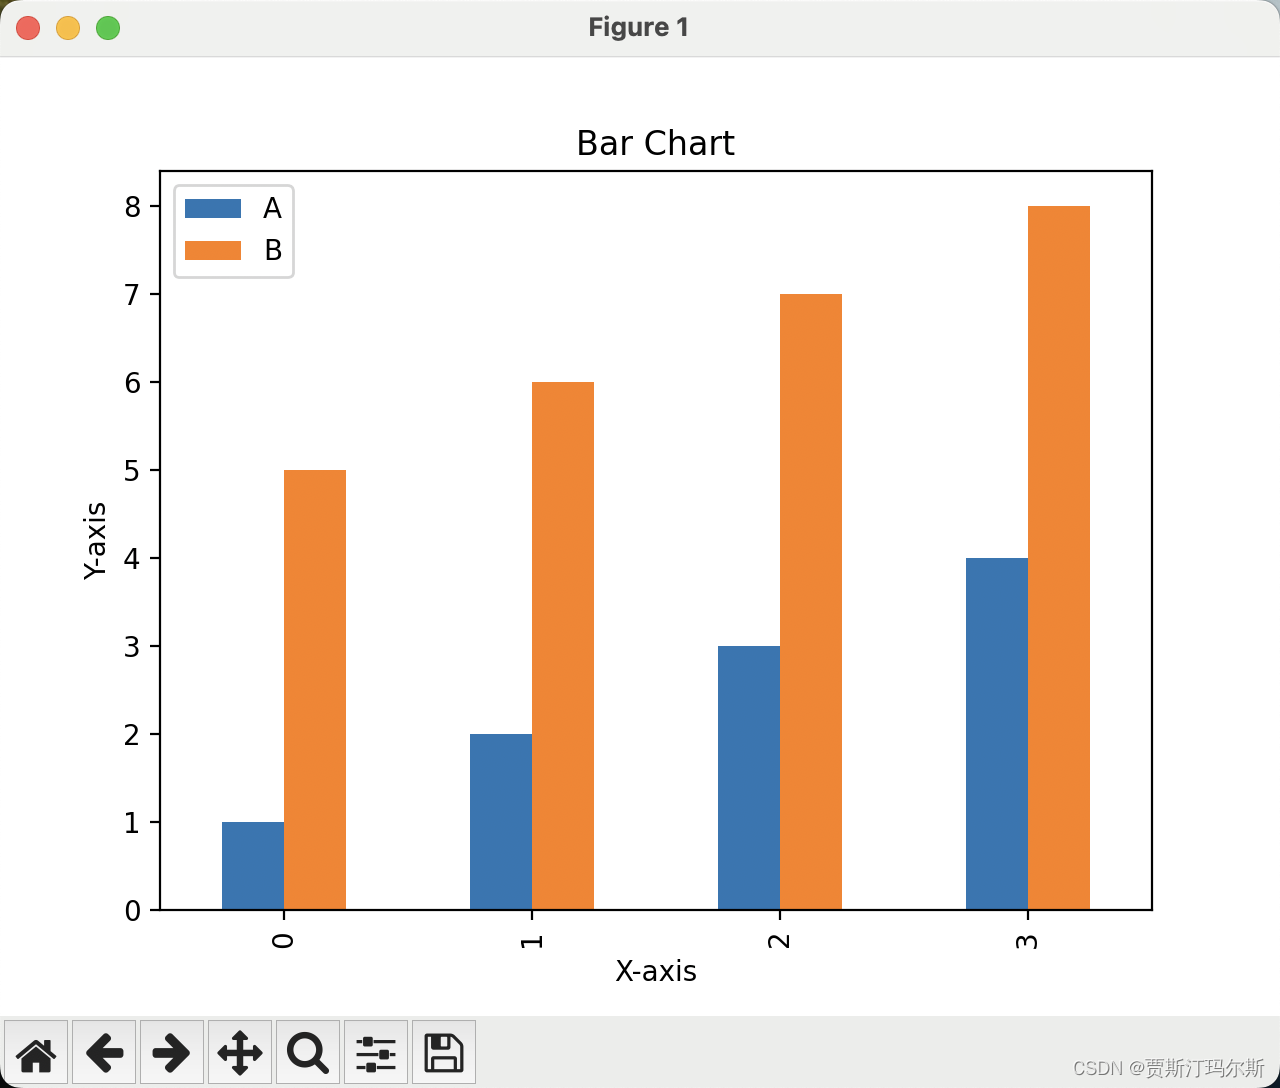
data = {'A': [1, 2, 3, 4], 'B': [5, 6, 7, 8]}
df = pd.DataFrame(data)# 绘制折线图
df.plot(kind='line')
plt.title('Line Plot')
plt.xlabel('X-axis')
plt.ylabel('Y-axis')
plt.show()# 绘制柱状图
df.plot(kind='bar')
plt.title('Bar Chart')
plt.xlabel('X-axis')
plt.ylabel('Y-axis')
plt.show()
4. Plotly:
import plotly.express as px# 绘制散点图
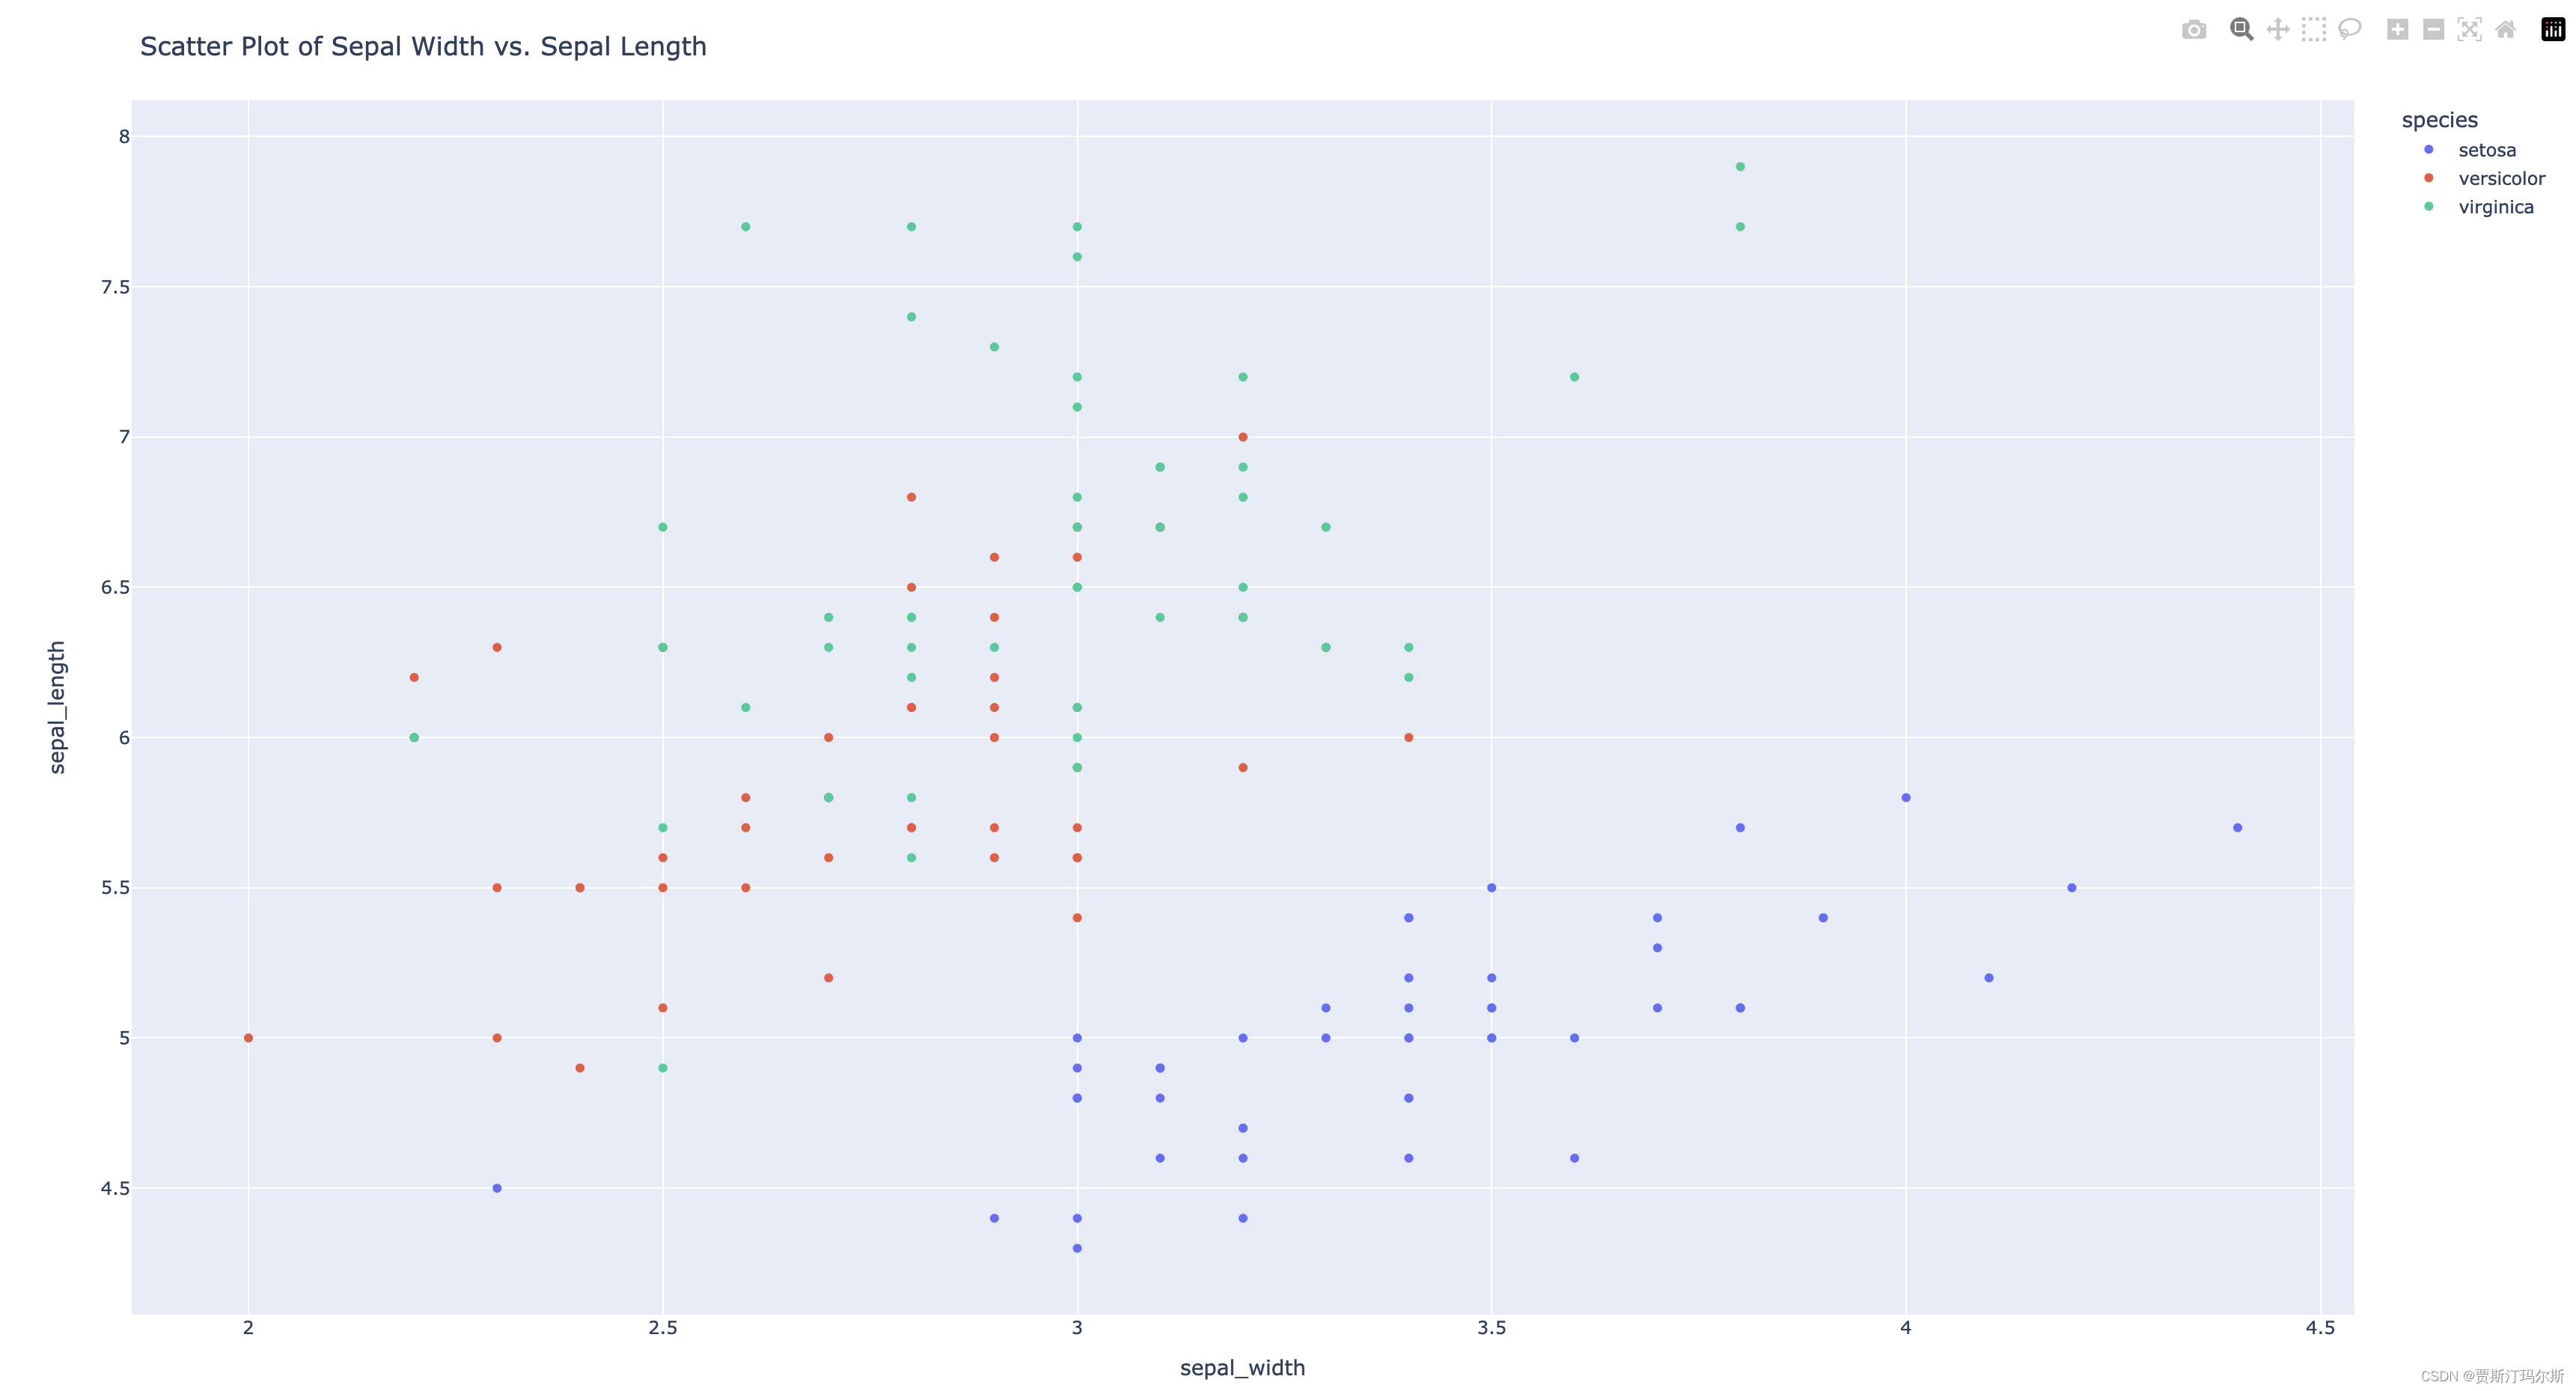
df = px.data.iris()
fig = px.scatter(df, x='sepal_width', y='sepal_length', color='species')
fig.update_layout(title='Scatter Plot of Sepal Width vs. Sepal Length')
fig.show()# 绘制线图
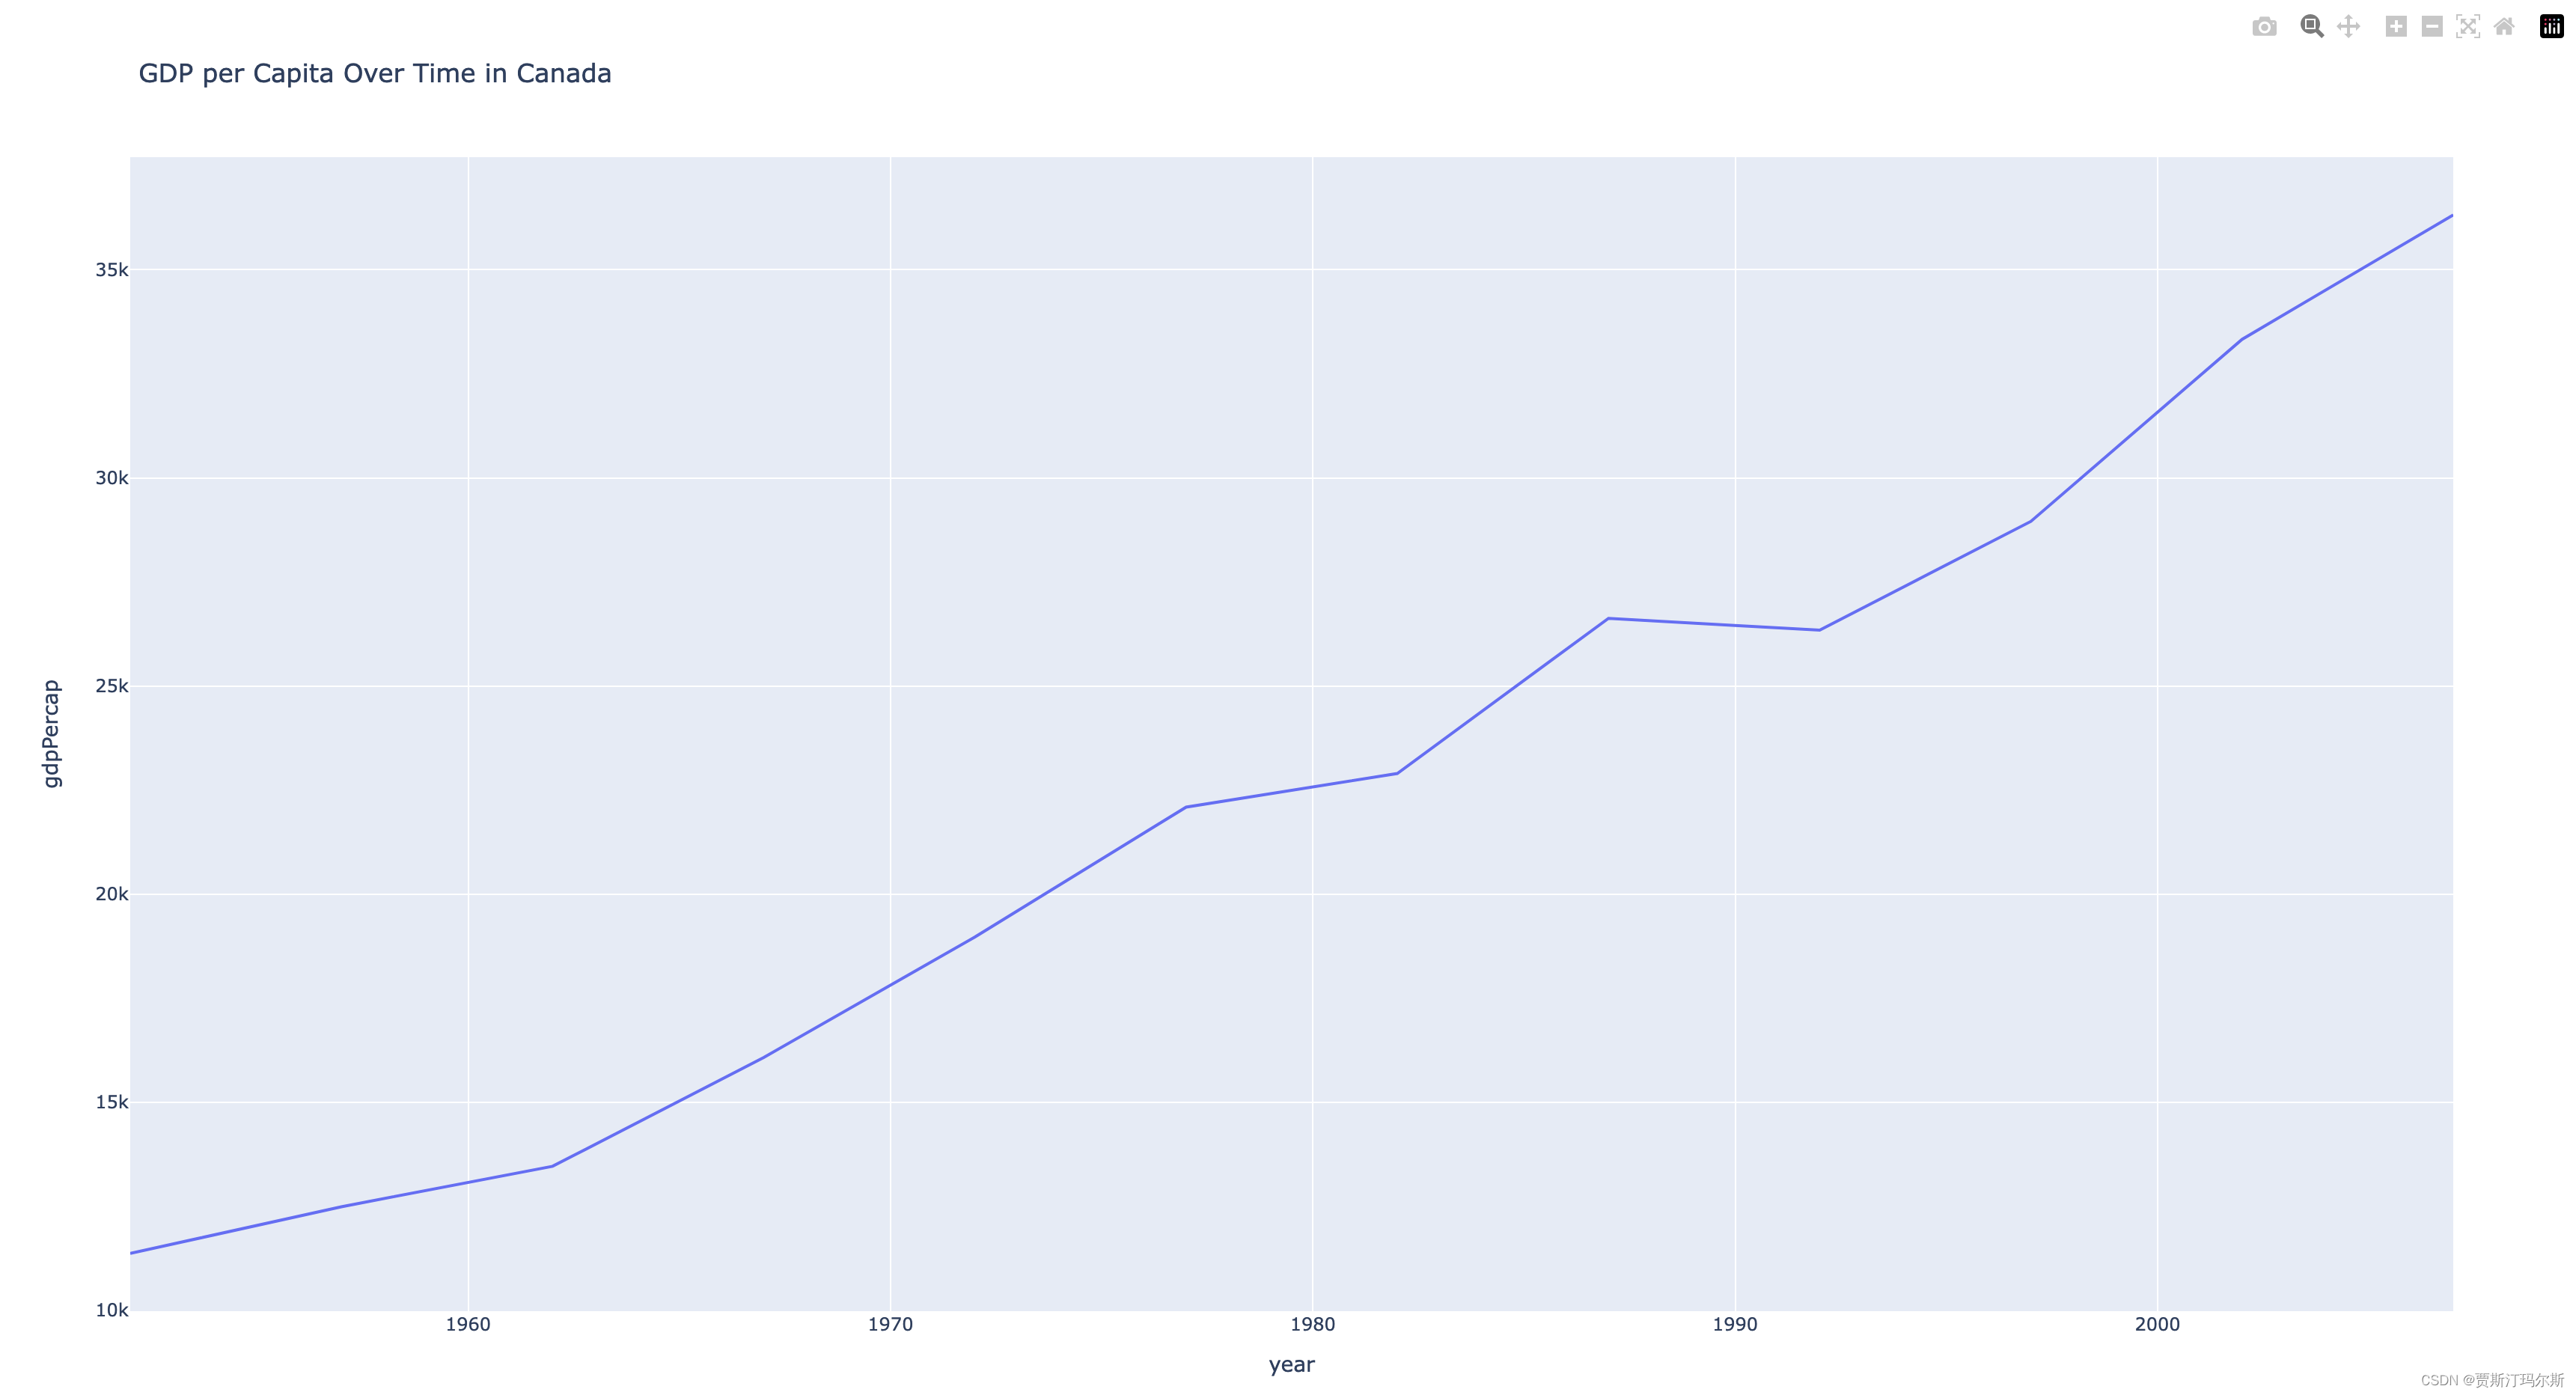
df = px.data.gapminder().query("country == 'Canada'")
fig = px.line(df, x='year', y='gdpPercap', title='GDP per Capita Over Time in Canada')
fig.show()
5. Bokeh:
from bokeh.plotting import figure, show
from bokeh.models import ColumnDataSource# 绘制线图
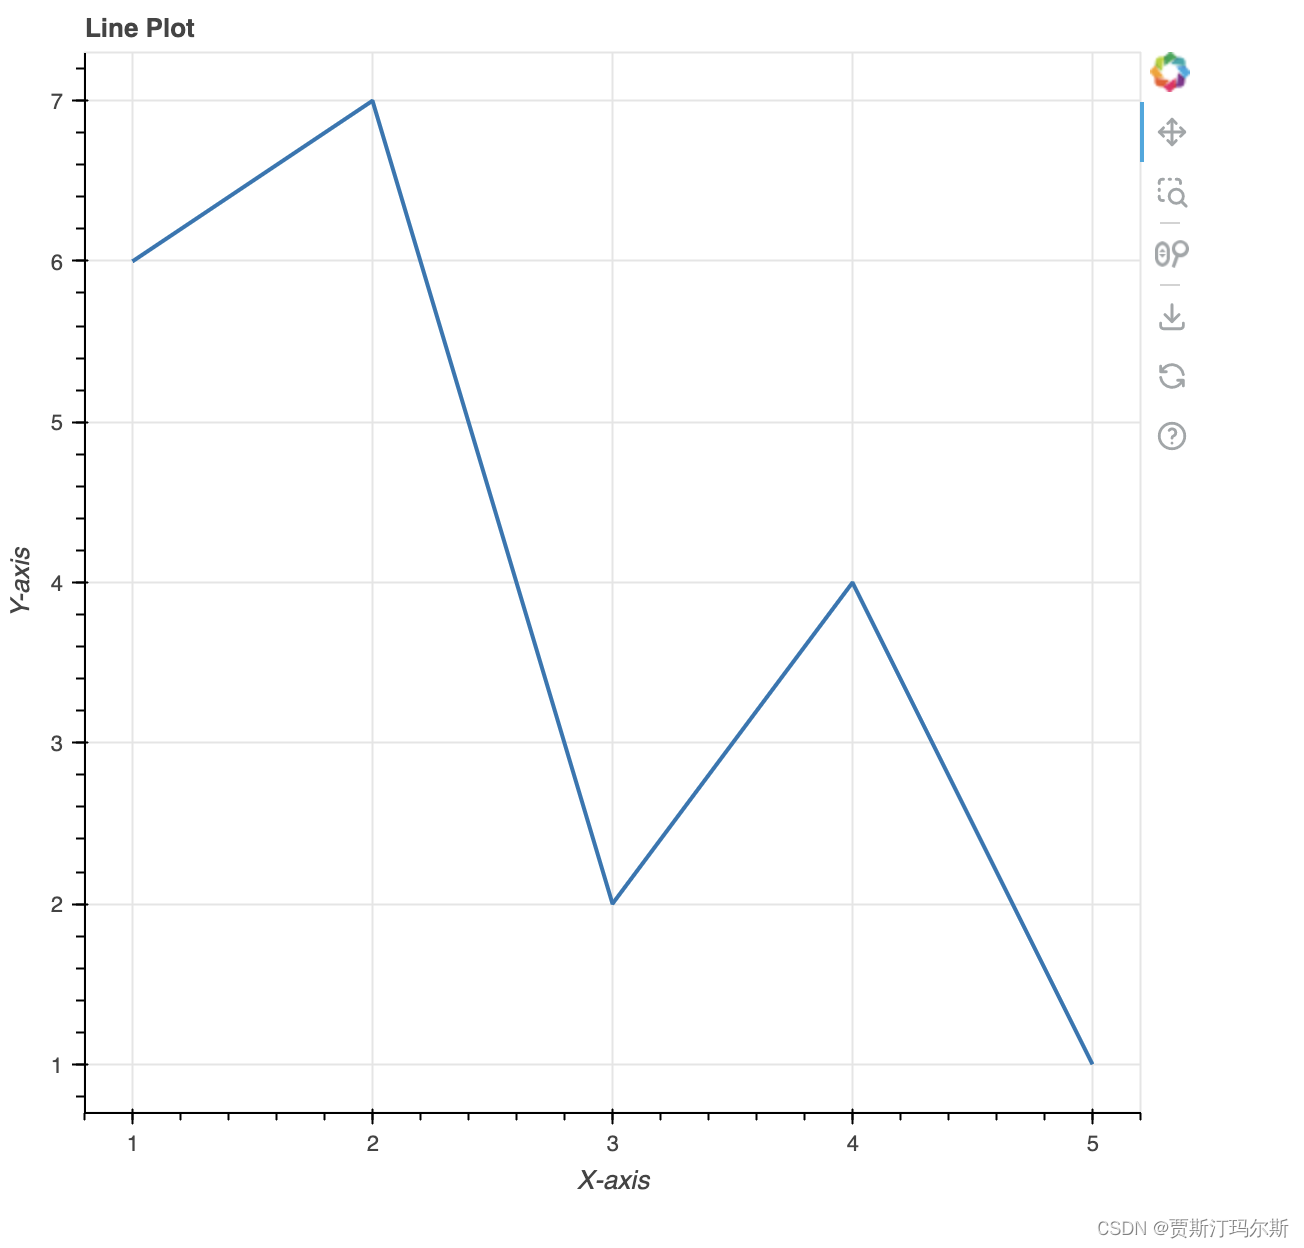
x = [1, 2, 3, 4, 5]
y = [6, 7, 2, 4, 1]
source = ColumnDataSource(data=dict(x=x, y=y))
p = figure(title='Line Plot', x_axis_label='X-axis', y_axis_label='Y-axis')
p.line('x', 'y', source=source, line_width=2)
show(p)# 绘制散点图
x = np.random.rand(50)
y = np.random.rand(50)
p = figure(title='Scatter Plot', x_axis_label='X-axis', y_axis_label='Y-axis')
p.circle(x, y, size=10, color='navy', alpha=0.5)
show(p)


)


)


