目录
1.上海市的空气质量
2.成都市的空气质量
【沈阳市空气质量情况详见下期】
五城P.M.2.5数据分析与可视化——北京市、上海市、广州市、沈阳市、成都市,使用华夫图和柱状图分析各个城市的情况
1.上海市的空气质量
import numpy as np
import pandas as pd
import matplotlib.pyplot as plt
from pywaffle import Waffle
import math
#读入文件
sh = pd.read_csv('./Shanghai.csv')
fig = plt.figure(dpi=100,figsize=(5,5))def good(pm):#优degree = []for i in pm:if 0 < i <= 35:degree.append(i)return degree
def moderate(pm):#良degree = []for i in pm:if 35 < i <= 75:degree.append(i)return degree
def lightlyP(pm):#轻度污染degree = []for i in pm:if 75 < i <= 115:degree.append(i)return degree
def moderatelyP(pm):#中度污染degree = []for i in pm:if 115 < i <= 150:degree.append(i)return degree
def heavilyP(pm):#重度污染degree = []for i in pm:if 150 < i <= 250:degree.append(i)return degree
def severelyP(pm):#严重污染degree = []for i in pm:if 250 < i:degree.append(i)return degreedef PM(sh,str3):sh_dist_pm = sh.loc[:, [str3]]sh_dist1_pm = sh_dist_pm.dropna(axis=0, subset=[str3])sh_dist1_pm = np.array(sh_dist1_pm[str3])sh_good_count = len(good(sh_dist1_pm))sh_moderate_count = len(moderate(sh_dist1_pm))sh_lightlyP_count = len(lightlyP(sh_dist1_pm))sh_moderatelyP_count = len(moderatelyP(sh_dist1_pm))sh_heavilyP_count = len(heavilyP(sh_dist1_pm))sh_severelyP_count = len(severelyP(sh_dist1_pm))a = {'优':sh_good_count,'良':sh_moderate_count,'轻度污染':sh_lightlyP_count,'中度污染':sh_moderatelyP_count,'重度污染':sh_heavilyP_count,'严重污染':sh_severelyP_count}pm = pd.DataFrame(pd.Series(a),columns=['daysum'])pm = pm.reset_index().rename(columns={'index':'level'})return pm
#上海
#PM_Jingan列
sh_jg = PM(sh,'PM_Jingan')
PMday_Jingan = np.array(sh_jg['daysum'])
#PM_Xuhui列
sh_xh = PM(sh,'PM_Xuhui')
PMday_Xuhui = np.array(sh_xh['daysum'])
sh_pm_daysum = (PMday_Jingan+PMday_Xuhui)/2
sum = 0
for i in sh_pm_daysum:sum += i
sh_pm_daysum1 = np.array(sh_pm_daysum)data = {'优':int((sh_pm_daysum[0]/sum)*100), '良':int((sh_pm_daysum[1]/sum)*100), '轻度污染': int(sh_pm_daysum[2]/sum*100),'中度污染':int((sh_pm_daysum[3]/sum)*100),'重度污染':int((sh_pm_daysum[4]/sum)*100),'严重污染':int((sh_pm_daysum[5]/sum)*100)}
total = np.sum(list(data.values()))
plt.figure(FigureClass=Waffle,rows = 5,   # 列数自动调整values = data,# 设置titletitle = {'label': "上海市污染情况",'loc': 'center','fontdict':{'fontsize': 13,}},labels = ['{} {:.1f}%'.format(k, (v/total*100)) for k, v in data.items()],# 设置标签图例的样式legend = {'loc': 'lower left','bbox_to_anchor': (0, -0.4),'ncol': len(data),'framealpha': 0,'fontsize': 6},dpi=120
)
plt.rcParams['font.sans-serif'] = ['Microsoft YaHei']
plt.show()

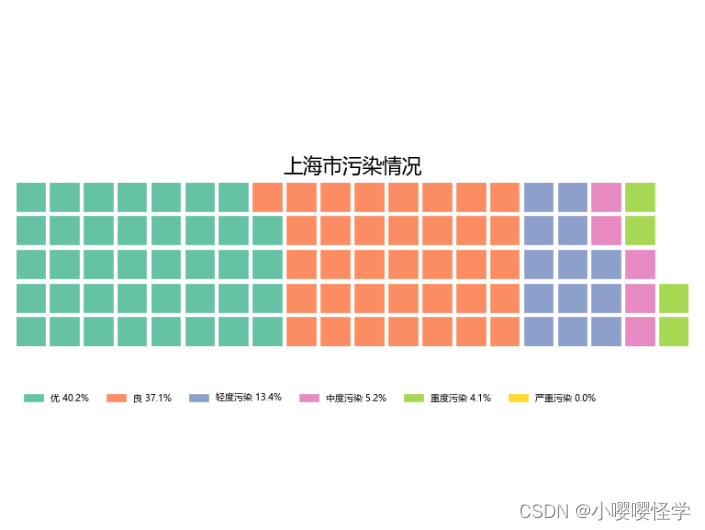
上海市总体空气质量良好,优和良的空气质量占比超过70%,只有不到1%的严重污染,中度污染和重度污染占比总和不超过10%。
2.成都市的空气质量
import numpy as np
import pandas as pd
import matplotlib.pyplot as plt
from pywaffle import Waffle#读入文件
cd = pd.read_csv('./Chengdu.csv')
fig = plt.figure(dpi=100,figsize=(5,5))def good(pm):#优degree = []for i in pm:if 0 < i <= 35:degree.append(i)return degree
def moderate(pm):#良degree = []for i in pm:if 35 < i <= 75:degree.append(i)return degree
def lightlyP(pm):#轻度污染degree = []for i in pm:if 75 < i <= 115:degree.append(i)return degree
def moderatelyP(pm):#中度污染degree = []for i in pm:if 115 < i <= 150:degree.append(i)return degree
def heavilyP(pm):#重度污染degree = []for i in pm:if 150 < i <= 250:degree.append(i)return degree
def severelyP(pm):#严重污染degree = []for i in pm:if 250 < i:degree.append(i)return degreedef PM(cd,str3):cd_dist_pm = cd.loc[:, [str3]]cd_dist1_pm = cd_dist_pm.dropna(axis=0, subset=[str3])cd_dist1_pm = np.array(cd_dist1_pm[str3])cd_good_count = len(good(cd_dist1_pm))cd_moderate_count = len(moderate(cd_dist1_pm))cd_lightlyP_count = len(lightlyP(cd_dist1_pm))cd_moderatelyP_count = len(moderatelyP(cd_dist1_pm))cd_heavilyP_count = len(heavilyP(cd_dist1_pm))cd_severelyP_count = len(severelyP(cd_dist1_pm))a = {'优':cd_good_count,'良':cd_moderate_count,'轻度污染':cd_lightlyP_count,'中度污染':cd_moderatelyP_count,'重度污染':cd_heavilyP_count,'严重污染':cd_severelyP_count}pm = pd.DataFrame(pd.Series(a),columns=['daysum'])pm = pm.reset_index().rename(columns={'index':'level'})return pm
#成都
#PM_Caotangsi列
cd_cts = PM(cd,'PM_Caotangsi')
PMday_Caotangsi = np.array(cd_cts['daysum'])
#PM_Shahepu列
cd_shp = PM(cd,'PM_Shahepu')
PMday_Shahepu = np.array(cd_shp['daysum'])
cd_pm_daysum = (PMday_Shahepu+PMday_Caotangsi)/2
sum = 0
for i in cd_pm_daysum:sum += i
cd_pm_daysum1 = np.array(cd_pm_daysum)data = {'优':int((cd_pm_daysum[0]/sum)*100), '良':int((cd_pm_daysum[1]/sum)*100), '轻度污染': int(cd_pm_daysum[2]/sum*100),'中度污染':int((cd_pm_daysum[3]/sum)*100),'重度污染':int((cd_pm_daysum[4]/sum)*100),'严重污染':int((cd_pm_daysum[5]/sum)*100)}
total = np.sum(list(data.values()))
plt.figure(FigureClass=Waffle,rows = 5,   # 列数自动调整values = data,# 设置titletitle = {'label': "成都市污染情况",'loc': 'center','fontdict':{'fontsize': 13,}},labels = ['{} {:.1f}%'.format(k, (v/total*100)) for k, v in data.items()],# 设置标签图例的样式legend = {'loc': 'lower left','bbox_to_anchor': (0, -0.4),'ncol': len(data),'framealpha': 0,'fontsize': 6},dpi=120
)
plt.rcParams['font.sans-serif'] = ['Microsoft YaHei']
plt.show()

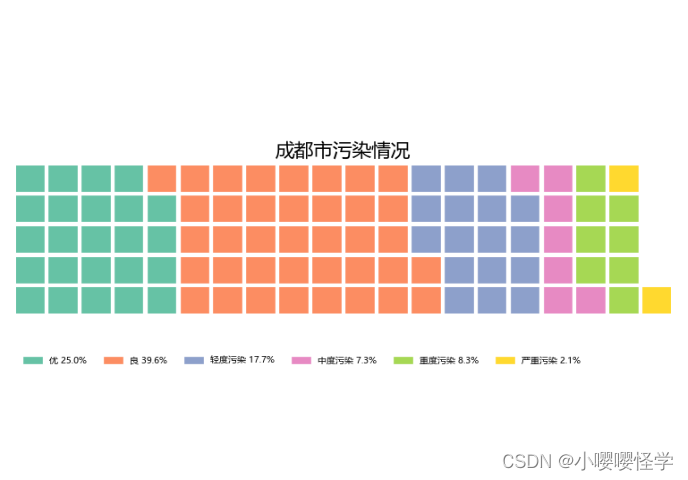
成都市总体空气质量较差,空气污染程度占比约35%——其中轻度污染占比约17%,中度污染占比约8%,重度污染占比约8%,严重污染占比约2%。
)
使用))


公有云--Dashboard服务)

