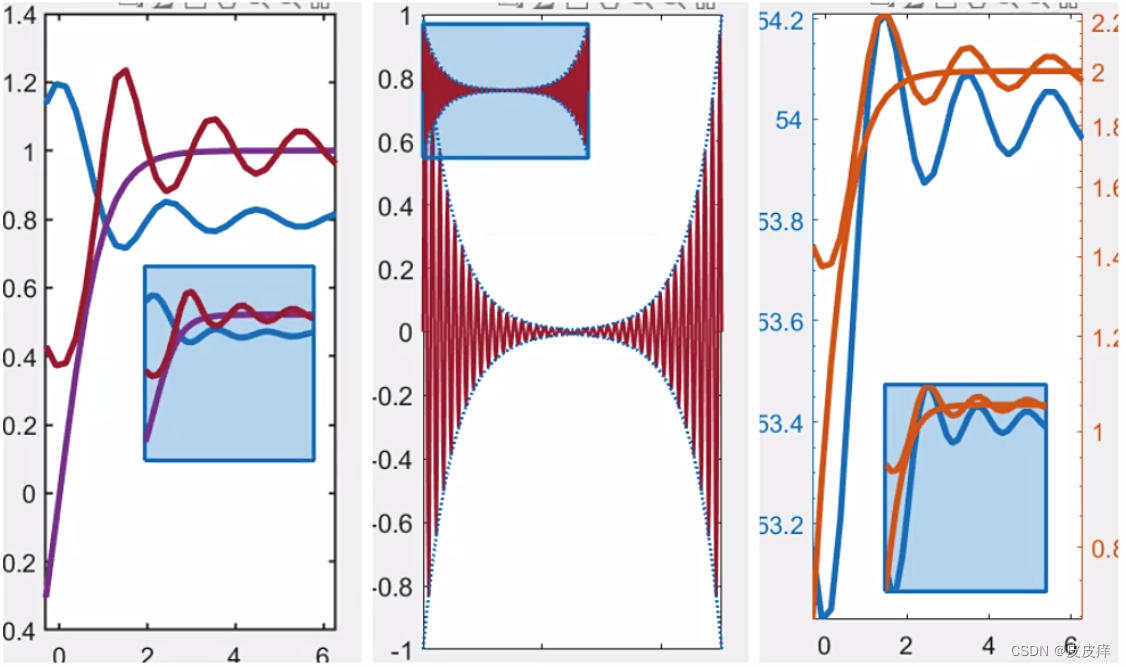
在数据可视化中,很多时候需要对某一区间的数据进行局部放大,以获得对比度更高的可视化效果。下面利用 MATLAB 语言实现一个交互式的局部放大图绘制。
源码自行下载:
链接:https://pan.baidu.com/s/1yItVSinh6vU4ImlbZW6Deg?pwd=9dyl 提取码:9dyl
使用方法:
1.将 BaseZoom.m 和 parameters.json 添加到 MATLAB 的搜索路径或者绘图代码所在的工作目录;
2.完成基本绘图之后,在命令行窗口或者绘图代码后面输入以下两行代码:
zp = BaseZoom();  % 添加 1 个放大区域
zp.plot;
如果要绘制多个放大区域,比如3个,则输入以下代码:
% 添加 3 个放大区域
zp = BaseZoom();
zp.plot;
zp.plot;
zp.plot;

绘图配置参数的自定义
ZoomPlot 的绘图配置参数存储在 parameters.json 中,默认值为:
{"subAxes": {"Color": "none","LineWidth": 1.2,"XGrid": "off","YGrid": "off","ZGrid": "off","GridAlpha": 0.15,"GridColor": [0.15, 0.15, 0.15],"GridLineStyle": "-","Box": "on","TickDir": "in","Comments": "theme of the sub axes"},"zoomedArea": {"Color": "k","FaceColor": "none","FaceAlpha": 0,"LineStyle": "-","LineWidth": 1.5,"Comments": "theme of the zoomed area"},"dynamicRect": {"LineColor": [0, 0.4471, 0.7412],"LineWidth": 2,"Marker": "s","MarkerSize": 9,"FaceColor": [0, 0.4471, 0.7412],"FaceAspect": 0.3,"EdgeColor": "k","Comments": "theme of the zoomed area"},"connection": {"LineColor": "k","LineWidth": 1.5,"LineStyle": ":","StartHeadStyle": "ellipse","StartHeadLength": 3,"StartHeadWidth": 3,"EndHeadStyle": "cback2","EndHeadLength": 7,"EndHeadWidth": 7,"Comments": "theme of the zoomed area"}}
可以看到,一共有四个部分的配置参数:
1.subAxes(子坐标系)
2.zoomedArea(放大区域)
3.dynamicRect(调整过程中的动态矩形)
4.connection(子坐标系和放大区域的连接线)
资料来源于知乎大佬@iqiukp !


 数据分组(数据透视、分类汇总) 详解 含代码 含测试数据集 随Pandas版本持续更新)

--模型剪枝Pruning)


)


