导读规则:
正文出现非加粗红色字体,对应Stata命令;
正文中出现蓝色字体,对应往期链接;
do文件中:"/**/"符号代表作者注释内容,帮助理解;"//"代表分节,便于阅读
本文关键词:legend
从图1中我们可以清楚地看到图例由键值对(keys)进行组合得到,键值对包括图形和文本两中元素。因此图例的美化就是对图形和文本的空间布局和属性设置进行修改,具体如下代码所示。
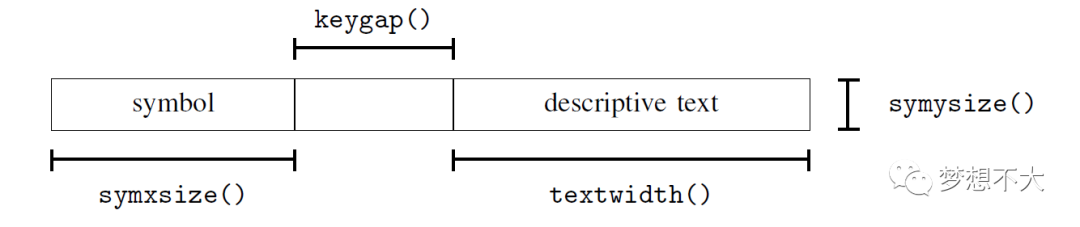
图1 图例元素组成
具体代码如下: ** 图例属性 #delimit ; twoway scatter zzs0 year,connect(l) msize(small) msymbol(T) || scatter yys0 year,connect(l) msize(small) msymbol(T) || scatter xfs0 year,connect(l) msize(small) msymbol(T) || scatter gs0 year,connect(l) msize(small) msymbol(T) || scatter grsds0 year,connect(l) msize(small) msymbol(T) || scatter qysds0 year,connect(l) msize(small) msymbol(T) || scatter qysds year,connect(l) msize(small) msymbol(T) yaxis(2) || , title("{bf:{it}中国税收收入结构 2010-2019}", position(12) ring(7) size(small) color(navy) box bexpand justification(center) margin(medium) bcolor(none)) xlabel(2010(1)2019 2014 "cutoff",add val format(%ty) angle(0) noalternate norescale labsize(small) labcolor(navy) tick tl(1) tp(c) tlsty(p2) tlw(0.5) tlc(cranberry) labgap(tiny) tstyle(major) nogrid gsty(default) glw(0.5) glc(gs10) glp(dot)) ylabel(0(10000)40000,axis(2) labsize(vsmall) tl(0.25) nogrid) ylabel(,labsize(vsmall) tl(0.25) nogrid) ysca(axis(2) nolog norev range(9000 41000) on fill fex ex li titleg(vsmall) outerg(*10) lsty(none) lc(black) lw(*1) lp(solid)) ysca(fill titleg(small)) xsca(fill titleg(small)) xmtick(##0) ymtick(##2,axis(2)) ymtick(##2) xtitle( "2010-2019年",size(small) bmargin(small)) ytitle("税收收入占比",box bexp size(small) color(navy) justification(center) al(middle) orient(vertical) margin(small) width(*1.2) height(*1.5) bcolor(none) fcolor(gs15) lpattern(none) lcolor(white) lwidth(thin) lalign(outside) bmargin(small)) ytitle("企业所得税收入",axis(2) box bexp size(small) c(navy) fcolor(gs15) width(*1.2) height(*1.5) lc(white) lp(none) margin(small) bm(small)) title("{bf:中国税收收入结构 2010-2019}", box bexpand position(12) ring(7) size(small) color(navy) justification(center) lp(none) lc(white) margin(large) fc(white)) /***************************图例的属性设置******************************************************************************************************************************/ legend( on /*on/off分别表示打开和关闭图例*/ order( 1 - " " 2 3 4 5 6 7 8) /*指定图例显示顺序,在1和2之间加了空格*/ lab(1 "增值税比重") lab(2 "营业税比重") lab(3 "消费税比重") lab(4 "关税比重") lab(5 "个人所得税比重") lab(6 "企业所得税比重") lab(7 "企业所得税金额") //重新定义图例的文本内容 holes(3) /*在第3个图例留空白*/ all style(colum) /* 设定图例的整体风格,graph query legendstyle查看具体类型,*/ //图形与文本的布局、大小、高度设置 cols(3) /*图例由键值对(key)组成,键值对包括图形和文本,将键值对分成3列*/ rows(3) /*将键值对分成3行*/ colf /*按列排序,默认是nocolf*/ notextf /*将文本放在图形后面,反义是textf*/ nostack /*stack代表文本和图形是堆叠展示,反义是nostack*/ rowgap(*0.2) /*规定行之间的距离,help relativesize查看类型*/ colgap(*1) /*规定列之间的距离,help relativesize查看类型*/ symplacement(center) /*规定文本与图形的相对位置,help compassdirstyle查看类型*/ keygap(*0.5) /*规定文本与图形之间的距离,help relativesize查看类型*/ symxsize(*0.5) /*规定图形宽度,help relativesize查看类型*/ symysize(*0.2) /*规定图形高度,,help relativesize查看类型*/ textwidth(*0.2) /*规定文本宽度,help relativesize查看类型*/ size(vsmall) /*规定文本字体大小,help relativesize查看类型*/ forcesize /*规定图形高度按照symxsize和symysize数值设定,如果未设定则会自动压缩*/ bmargin(small) /*规定图例与其他图表元素的间隔距离,help marginstye查看类型*/ subtitle("{bf:各项税收比重}",size(tiny) color(cranberry)) /*可添加title选择项,对图例进行说明*/ //图例的边界与填充颜色设置 region( style(outline) /*对总体风格进行设置,help areastyle查看具体类型*/ color(none)) /*规定图例的边界线和填充颜色*/ fcolor(white) /*设定背景填充颜色,help colorstyle查看颜色种类及表达方式*/ lstyle(none) /*设定图例边界线的总体属性,help linestyle查看选择项内容*/ lcolor(white) /*设定图例边界线颜色,help colorstyle查看颜色种类及表达方式*/ lwidth(*0.5) /*设定图例边界线粗细,help linealignmentstyle查看可选类型*/ lpattern(none) /*设定图例边界线类型,help linepatternstyle/linewidthstyle查看线条类型和粗细的选择项*/ lalign(inside) /*设定图例边界线方向,help linealignmentstyle查看类型*/ margin(small) /*规定图例内容与边界线之间的六百距离*/ //图例的位置 position(6) ring(1) span /*将图例扩展到整个图表区域*/ ) graphregion(color(white)) ; delimit cr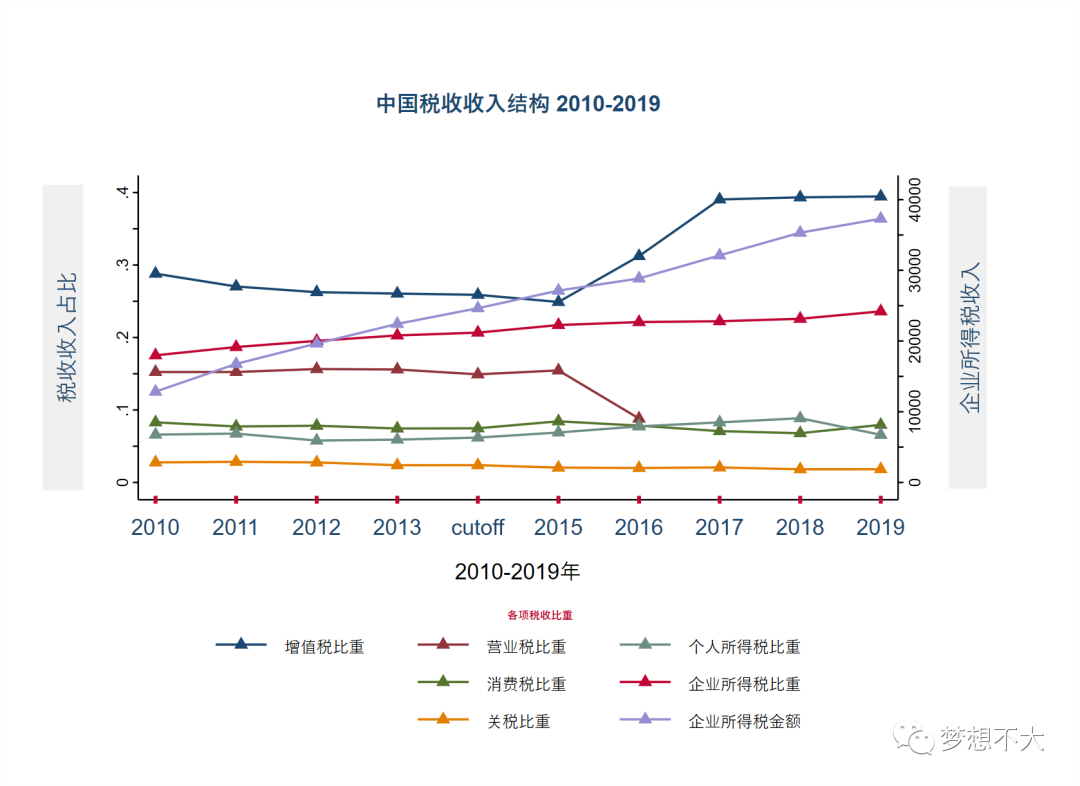
新手上路一枚,有解读错误的地方请大家多多指正!
点个赞、打个赏、转个发,都是对作者莫大的鼓励


)


![bzoj 2245 [SDOI2011]工作安排【最小费用最大流】](http://pic.xiahunao.cn/bzoj 2245 [SDOI2011]工作安排【最小费用最大流】)
)


(全国计算机等级考试预测试卷与真考题库)...)


![织梦缩略图自动补齐绝对路径_[教程]织梦CMS缩略图和文章内容图片自动转化为带域名的绝对路径...](http://pic.xiahunao.cn/织梦缩略图自动补齐绝对路径_[教程]织梦CMS缩略图和文章内容图片自动转化为带域名的绝对路径...)