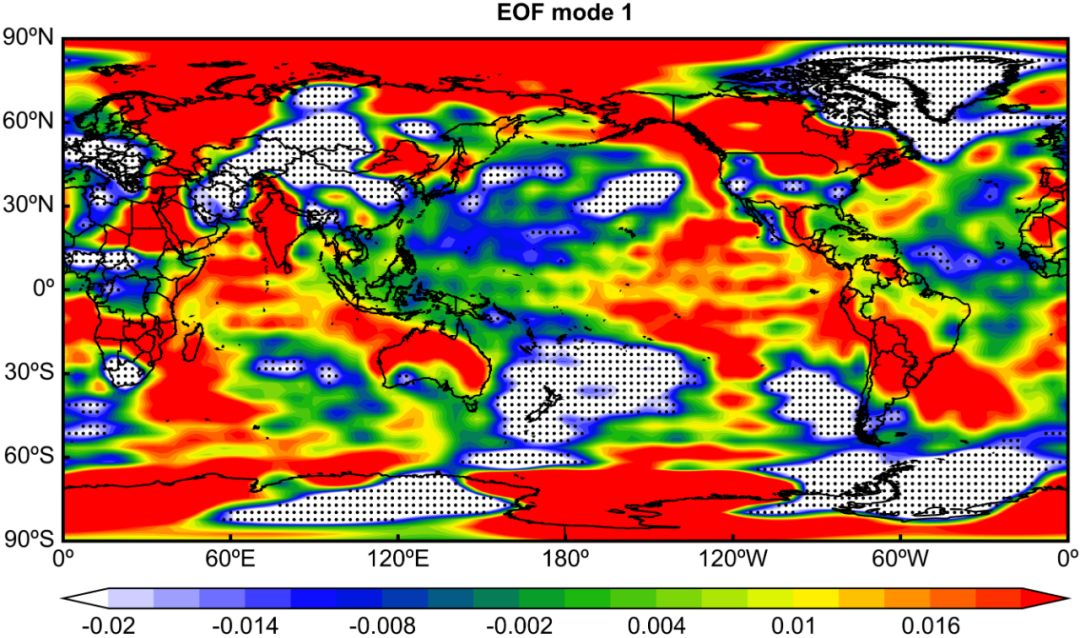
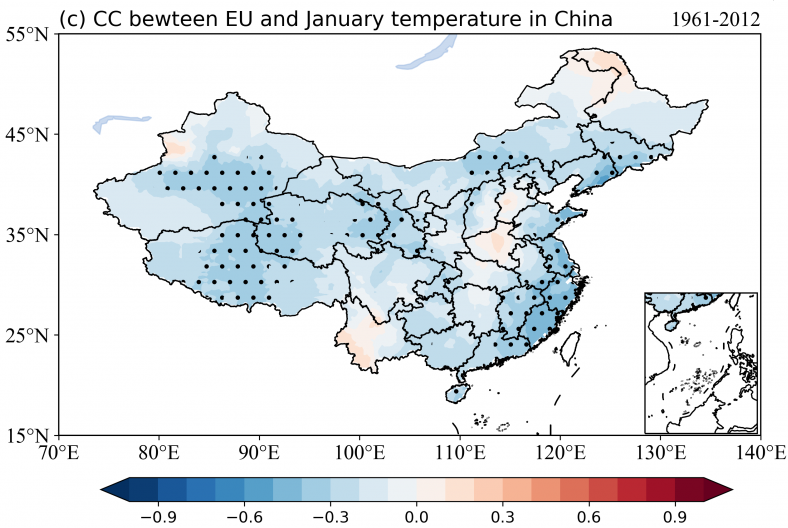
MeteoInfo显著性检验:
MeteoInfo官网:
http://www.meteothink.org
源代码:
https://github.com/meteoinfo
fn = 'F:/RMeteoInfo/data/test.txt'ny = 71nx = 144m = ny * nxn = 62ss1 = asciiread(fn, shape=(71,144,n))ss1 = ss1[::-1,::1,:]X = ss1.reshape(ny * nx, n)#Time-space transformC = dot(X.T, X)E1, EOF1 = linalg.eig(C)EOF1 = EOF1.T[:,::-1]E = diag(E1[::-1])EOFa = dot(X, EOF1)EOF = zeros((m,n))for i in range(n): EOF[:,i] = EOFa[:,i]/sqrt(E[i,i])PC = dot(EOF.T, X)PC = PC[::-1,:]eof1 = EOF[:,0].reshape(ny, nx)eof2=eof1.copy()eof2[eof2>-0.014]=nan#Plotaxesm()lon = linspace(0, 360, nx)lat = linspace(-90, 90, ny)geoshow('country', edgecolor='k')levs = arange(-0.02, 0.021, 0.002)layer = contourfm(lon, lat, eof1, levs,cmap='WhBlGrYeRe',smooth=False)scatter(lon, lat, eof2, facecolor='k',size=2,edgecolor=None)title('EOF mode 1')xlim(0, 360)ylim(-90, 90)xticks(arange(0, 361, 30),bold=True,fontsize=15)yticks(arange(-90, 91, 30),bold=True,fontsize=15)colorbar(layer, orientation='horizontal',ticklen=0,extendrect=False, shrink=1, aspect=50)yaxis(tickvisible=True,location='left',tickwidth=2,linewidth=2,ticklength=3) #ticklength刻度线长度,tickwidth刻度线宽度,linewidth边框宽度yaxis(tickvisible=False,location='right',tickwidth=2,linewidth=2,ticklength=4) #分别调试tick的宽度,边框线宽和tick的长度xaxis(tickvisible=False,location='top',tickwidth=2,linewidth=2,ticklength=4) xaxis(tickvisible=True,location='bottom',tickwidth=2,linewidth=2,ticklength=3)savefig('F:/RMeteoInfo/plot58.3.png', dpi=1200)
Python显著性检验:
往期推文超链接1:
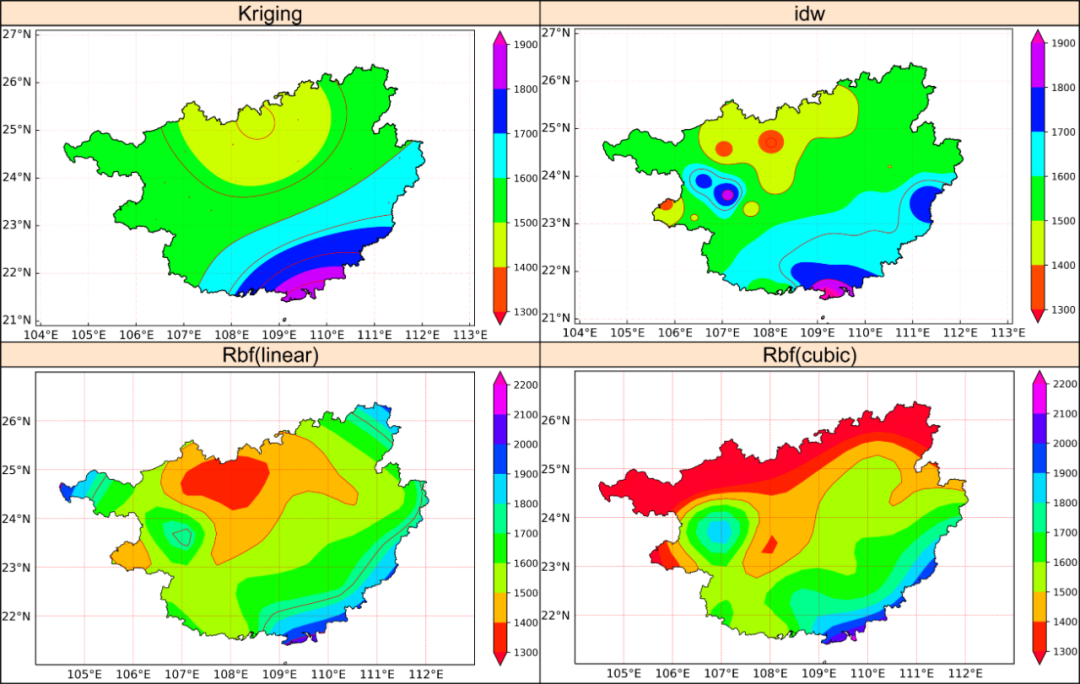
《R语言、MeteoInfo、Python和ArcGis的Kriging、IDW空间插值结果的对比分析》

往期推文超链接2:
1 《Python基础地图构建(九)》
2 《Python基础地图构建(33)》
3 《Python基础地图构建(28)》
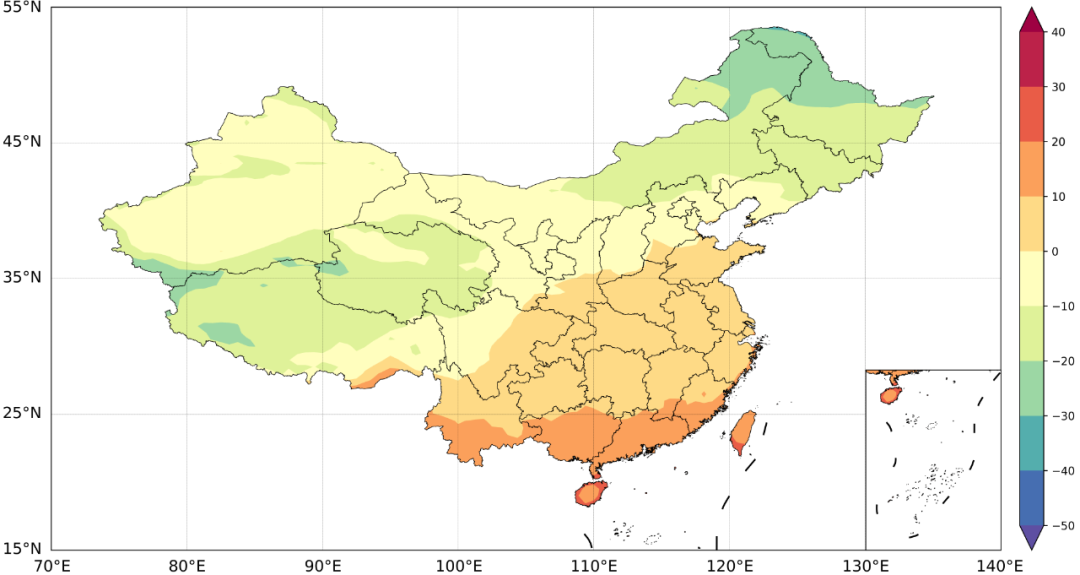
4 《基于Python的NCEP再分析数据的中国区域白化(含南海小地图)》


)


——结构与指令集...)


)


