本文与《20天吃透Pytorch》有所不同,《20天吃透Pytorch》中是继承之前的模型进行拟合,本文是单独建立网络进行拟合。
代码实现:
import torch
import numpy as np
import matplotlib.pyplot as plt
import pandas as pd
from torch import nn
import torch.nn.functional as F
from torch.utils.data import Dataset,DataLoader,TensorDataset"""
1.准备数据
"""
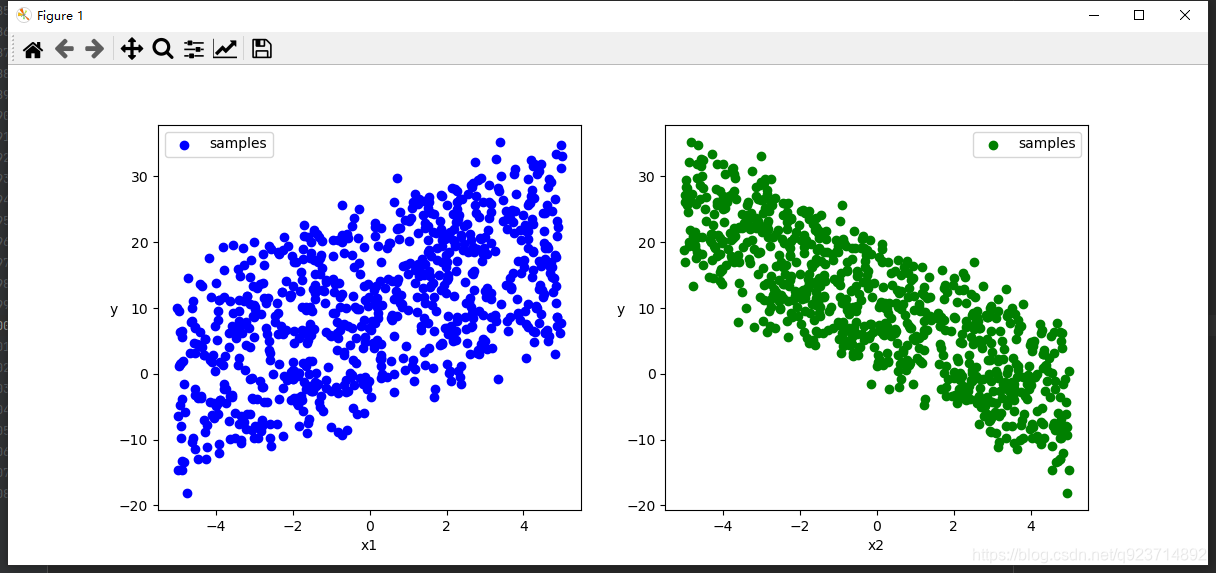
n=800   #样本数量#生成测试用的数据集
X = 10*torch.rand([n,2])-5.0    #torch.rand是均匀分布
w0 = torch.tensor([[2.0],[-3.0]])
b0 = torch.tensor([10.0])
Y = X@w0 + b0 + torch.normal(0.0,2.0,size=[n,1])    ## @表示矩阵乘法,增加正态扰动#数据可视化
plt.figure(figsize= (12,5))
ax1 = plt.subplot(121)
ax1.scatter(X[:,0],Y[:,0],c = 'b',label = 'samples')
ax1.legend()    #图例
plt.xlabel("x1")
plt.ylabel("y",rotation = 0)
ax2 = plt.subplot(122)
ax2.scatter(X[:,1],Y[:,0],c = 'g',label = 'samples')
ax2.legend()
plt.xlabel('x2')
plt.ylabel('y',rotation = 0)
plt.show()"""
构建通道
"""ds = TensorDataset(X,Y)
ds_train,ds_valid = torch.utils.data.random_split(ds,[int (n*0.7),n-int(n*0.7)])  #选取总样本的70%为训练数据
dl_train = DataLoader(ds_train,batch_size=10,shuffle=True)
dl_valid = DataLoader(ds_valid,batch_size=10,shuffle=True)"""
2.定义模型
"""class LinearRegression(torch.nn.Module):def __init__(self):super(LinearRegression, self).__init__()self.fc = nn.Linear(2,1)def forward(self,x):x = self.fc(x)return xnet = LinearRegression()
"""
3.训练模型
"""
loss_func = torch.nn.MSELoss()
optimizer= torch.optim.Adam(net.parameters(),lr = 0.01)eporchs = 10
log_step_freq = 20for eporch in range(1,eporchs+1):net.train()loss_sum = 0.0metric_sum = 0.0step = 1for step,(features,labels) in enumerate(dl_train,1):predictions = net(features)loss = loss_func(predictions,labels)optimizer.zero_grad()loss.backward()optimizer.step()w = net.state_dict()["fc.weight"]b = net.state_dict()["fc.bias"]print("step =", step, "loss = ", loss)print("w =", w)print("b =", b)loss_sum += loss.item()"""
结果可视化
"""
w,b = net.state_dict()["fc.weight"],net.state_dict()["fc.bias"]plt.figure(figsize = (12,5))
ax1 = plt.subplot(121)
ax1.scatter(X[:,0],Y[:,0], c = "b",label = "samples")
ax1.plot(X[:,0],w[0,0]*X[:,0]+b[0],"-r",linewidth = 5.0,label = "model")
ax1.legend()
plt.xlabel("x1")
plt.ylabel("y",rotation = 0)ax2 = plt.subplot(122)
ax2.scatter(X[:,1],Y[:,0], c = "g",label = "samples")
ax2.plot(X[:,1],w[0,1]*X[:,1]+b[0],"-r",linewidth = 5.0,label = "model")
ax2.legend()
plt.xlabel("x2")
plt.ylabel("y",rotation = 0)plt.show()
结果展示:
数据部分:

线性回归结果:


)
![【洛谷算法题】P1046-[NOIP2005 普及组] 陶陶摘苹果【入门2分支结构】Java题解](http://pic.xiahunao.cn/【洛谷算法题】P1046-[NOIP2005 普及组] 陶陶摘苹果【入门2分支结构】Java题解)
)


