皮尔逊相关系数 相似系数
数据科学和机器学习统计 (STATISTICS FOR DATA SCIENCE AND MACHINE LEARNING)
In the last post, we analyzed the relationship between categorical variables and categorical and continuous variables. In this case, we will analyze the relation between two ratio level or continuous variables.
在上一篇文章中,我们分析了类别变量与类别变量和连续变量之间的关系。 在这种情况下,我们将分析两个比率级别或连续变量之间的关系。
Peason’s Correlation, sometimes just called correlation, is the most used metric for this purpose, it searches the data for a linear relationship between two variables.
Peason的相关性 (有时也称为相关性 )是为此目的最常用的度量标准,它在数据中搜索两个变量之间的线性关系。
Analyzing the correlations is one of the first steps to take in any statistics, data analysis, or machine learning process, it allows data scientists to early detect patterns and possible outcomes of the machine learning algorithms, so it guides us to choose better models.
分析相关性是进行任何统计,数据分析或机器学习过程的第一步之一,它使数据科学家能够及早发现机器学习算法的模式和可能的结果,从而指导我们选择更好的模型。
Correlation is a measure of relation between variables, but cannot prove causality between them.
相关性是变量之间关系的度量,但不能证明变量之间的因果关系。
Some examples of random correlations that exist in the world are found un this website.
在此网站上可以找到世界上存在的随机相关性的一些示例。
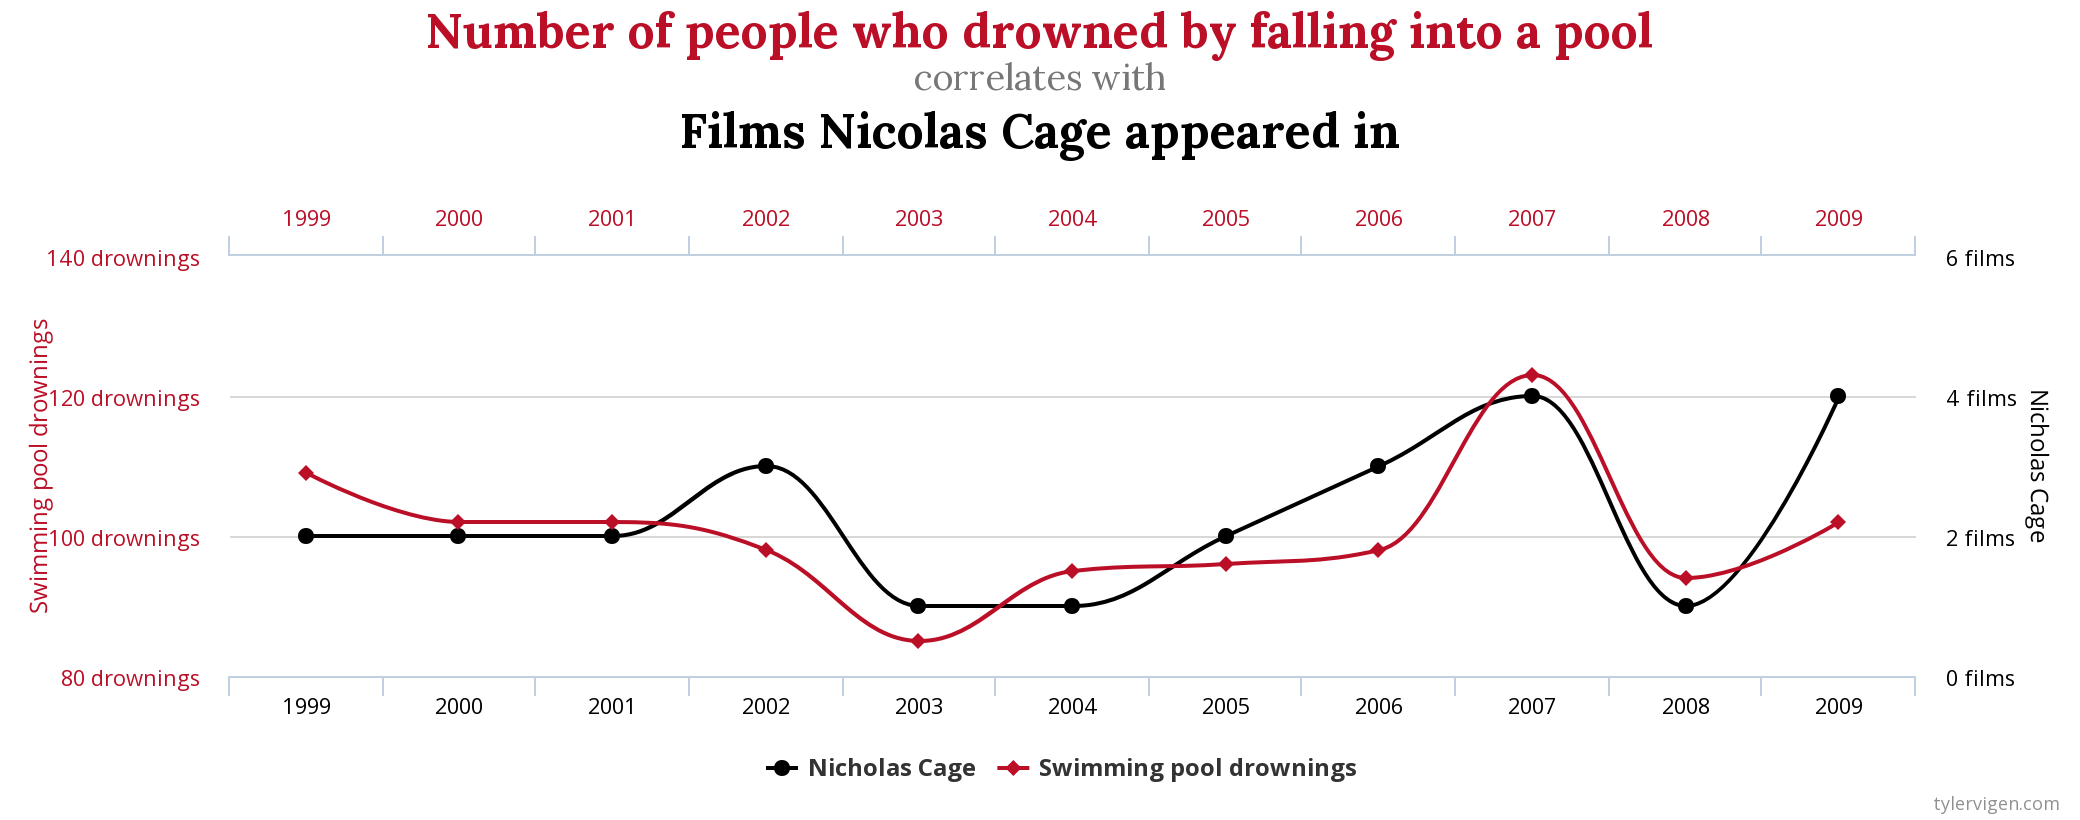
In the case of the last graph, it’s clearly not true that one of these variables implies the other one, even having a correlation of 99.79%
在最后一张图的情况下,显然这些变量中的一个隐含了另一个变量,即使相关性为99.79%
散点图 (Scatterplots)
To take the first look to our dataset, a good way to start is to plot pairs of continuous variables, one in each coordinate. Each point on the graph corresponds to a row of the dataset.
首先看一下我们的数据集,一个好的开始方法是绘制成对的连续变量,每个坐标中一个。 图上的每个点都对应于数据集的一行。
Scatterplots give us a sense of the overall relationship between two variables:
散点图使我们大致了解两个变量之间的整体关系:
- Direction: positive or negative relation, when one variable increases the second one increases or decreases? 方向:正向或负向关系,当一个变量增加时,第二个变量增加或减少?
- Strength: how much a variable increases when the second one increases. 强度:第二个变量增加时变量增加多少。
- Shape: The relation is linear, quadratic, exponential…? 形状:该关系是线性,二次方,指数...?
Using scatterplots is a fast technique for detecting outliers if a value is widely separated from the rest, checking the values for this individual will be useful.
如果值与其他值之间的距离较远,则使用散点图是检测异常值的快速技术,检查该个人的值将非常有用。
We will go with the most used data frame when studying machine learning, Iris, a dataset that contains information about iris plant flowers, and the objective of this one is to classify the flowers into three groups: (setosa, versicolor, virginica).
在研究机器学习时,我们将使用最常用的数据框架Iris,该数据集包含有关鸢尾花的信息,而该数据集的目的是将花分为三类:(setosa,versicolor,virginica)。

The objective of the iris dataset is to classify the distinct types of iris with the data that we have, to deliver the best approach to this problem, we want to analyze all the variables that we have available and their relations.
虹膜数据集的目的是用我们拥有的数据对虹膜的不同类型进行分类,以提供解决此问题的最佳方法,我们要分析所有可用变量及其关系。
In the last plot we have the petal length and width variables, and separate the distinct classes of iris in colors, what we can extract from this plot is:
在最后一个绘图中,我们具有花瓣的长度和宽度变量,并用颜色分隔了虹膜的不同类别,我们可以从该绘图中提取出以下内容:
- There’s a positive linear relationship between both variables. 这两个变量之间存在正线性关系。
- Petal length increases approximately 3 times faster than the petal width. 花瓣长度的增加速度大约是花瓣宽度的3倍。
- Using these 2 variables the groups are visually differentiable. 使用这两个变量,这些组在视觉上是可区分的。
散点图矩阵 (Scatter Plot Matrix)
To plot all relations at the same time and on the same graph, the best approach is to deliver a pair plot, it’s just a matrix of all variables containing all the possible scatterplots.
要同时在同一张图上绘制所有关系,最好的方法是绘制一对图,它只是包含所有可能的散点图的所有变量的矩阵。
As you can see, the plot of the last section is in the last row and third column of this matrix.
如您所见,最后一部分的图形位于此矩阵的最后一行和第三列中。
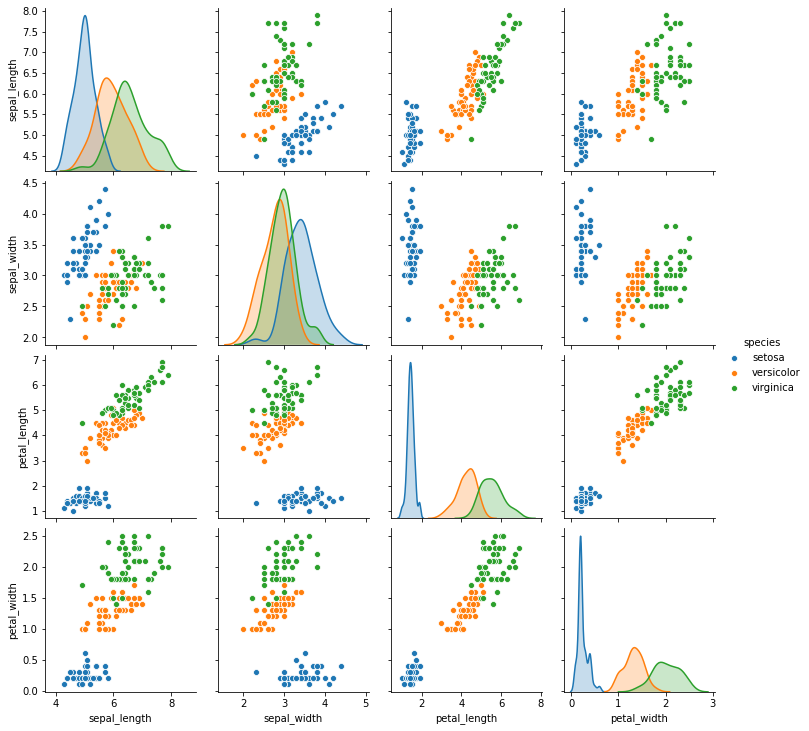
In this matrix, the diagonal can show distinct plots, in this case, we used the distributions of each one of the iris classes.
在此矩阵中,对角线可以显示不同的图,在这种情况下,我们使用了每个虹膜类别的分布。
Being a matrix, we have two plots for each combination of variables, there’s always a plot combining the same variables inverse of the (column, row), the other side of the diagonal.
作为一个矩阵,对于每种变量组合,我们都有两个图,总有一个图将(列,行)的反变量(对角线的另一侧)的相同变量组合在一起。
Using this matrix we can obtain all the information about all the continuous variables in the dataset easily.
使用此矩阵,我们可以轻松获取有关数据集中所有连续变量的所有信息。
皮尔逊相关系数 (Pearson Correlation Coefficient)
Scatter plots are an important tool for analyzing relations, but we need to check if the relation between variables is significant, to check the lineal correlation between variables we can use the Person’s r, or Pearson correlation coefficient.
散点图是分析关系的重要工具,但是我们需要检查变量之间的关系是否显着,要检查变量之间的线性相关性,可以使用Person的r或Pearson相关系数。
The range of the possible results of this coefficient is (-1,1), where:
该系数可能的结果范围是(-1,1) ,其中:
- 0 indicates no correlation. 0表示没有相关性。
- 1 indicates a perfect positive correlation. 1表示完全正相关。
- -1 indicates a perfect negative correlation. -1表示完美的负相关。
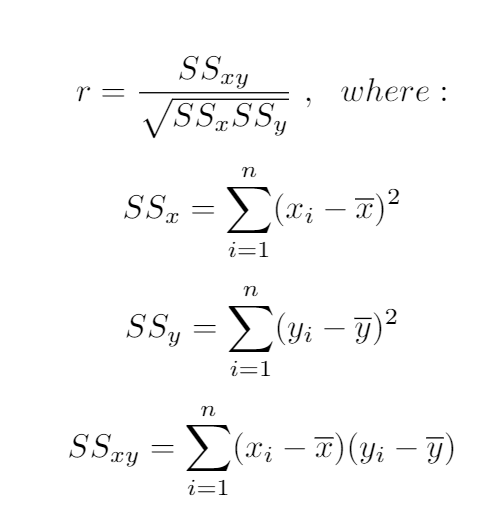
To calculate this statistic we use the following formula:
要计算此统计信息,我们使用以下公式:
相关系数的检验显着性 (Test significance of correlation coefficient)
We need to check if the correlation is significant for our data, as we already talked about hypothesis testing, in this case:
我们已经讨论过假设检验,在这种情况下,我们需要检查相关性对我们的数据是否有意义:
H0 = The variables are unrelated, r = 0
H0 =变量无关,r = 0
Ha = The variables are related, r ≠ 0
Ha =变量相关,r≠0
This statistic has a t-student distribution with (n-2) degrees of significance, being n the number of values.
此统计信息的t学生分布的有意义度为(n-2)个,值为n个值。
The formula for the t value is the following, and we need to compare the result with the t-student table.
t值的公式如下,我们需要将结果与t学生表进行比较。
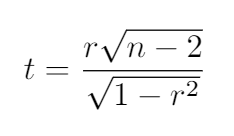
If our result is bigger than the table value we reject the null hypothesis and say that the variables are related.
如果我们的结果大于表值,则我们拒绝原假设,并说变量是相关的。
确定系数 (Coefficient of determination)
To calculate how much the variation of a variable can affect the variation of the other one, we can use the coefficient of determination, calculated as the r². This measure will be very important in regression models.
为了计算一个变量的变化能对另一个变量的变化产生多大的影响,我们可以使用确定系数 ,计算为r² 。 该度量在回归模型中将非常重要。
摘要 (Summary)
In the last post, we talked about correlation for categorical data and mentioned that the correlation for continuous variables is easier, in this case, we explained how to perform this correlation analysis and how to check if it’s statistically significant.
在上一篇文章中,我们讨论了分类数据的相关性,并提到了连续变量的相关性更容易,在这种情况下,我们说明了如何执行此相关性分析以及如何检查其是否具有统计意义。
Adding to the typical analysis of the statistical significance will give a better understanding about how to use each variable.
除了对统计意义进行典型分析之外,还将对如何使用每个变量有更好的理解。
This is the eleventh post of my particular #100daysofML, I will be publishing the advances of this challenge at GitHub, Twitter, and Medium (Adrià Serra).
这是我特别#100daysofML第十一届文章中,我将出版在GitHub上,Twitter和中型企业(这一挑战的进步阿德里亚塞拉 )。
https://twitter.com/CrunchyML
https://twitter.com/CrunchyML
https://github.com/CrunchyPistacho/100DaysOfML
https://github.com/CrunchyPistacho/100DaysOfML
翻译自: https://medium.com/ai-in-plain-english/pearson-correlation-coefficient-14c55d32c1bb
皮尔逊相关系数 相似系数
本文来自互联网用户投稿,该文观点仅代表作者本人,不代表本站立场。本站仅提供信息存储空间服务,不拥有所有权,不承担相关法律责任。如若转载,请注明出处:http://www.mzph.cn/news/388853.shtml
如若内容造成侵权/违法违规/事实不符,请联系多彩编程网进行投诉反馈email:809451989@qq.com,一经查实,立即删除!相关文章
![【洛谷】P1641 [SCOI2010]生成字符串(思维+组合+逆元)](http://pic.xiahunao.cn/【洛谷】P1641 [SCOI2010]生成字符串(思维+组合+逆元))
【洛谷】P1641 [SCOI2010]生成字符串(思维+组合+逆元)

Kubernetes持续交付-Jenkins X的Helm部署
暑期集训--二进制(BZOJ5294)【线段树】)
中国石油大学(华东)暑期集训--二进制(BZOJ5294)【线段树】

2018年10个最佳项目管理工具及链接

Java 8 新特性之Stream API
![[Python设计模式] 第17章 程序中的翻译官——适配器模式](http://pic.xiahunao.cn/[Python设计模式] 第17章 程序中的翻译官——适配器模式)
[Python设计模式] 第17章 程序中的翻译官——适配器模式

Ubuntu中NS2安装详细教程


带你利用一句话完成转场动画

14.vue路由脚手架

工程师、产品经理、数据工程师是如何一起工作的?

linux-buff/cache过大导致内存不足-程序异常
)
Android 适配(一)
)
Source Insight 创建工程(linux-2.6.22.6内核源码)

课时20:内嵌函数和闭包

从零开始学产品第六篇:更强大的测试,自动化测试和性能测试

Get 了滤镜、动画、AR 特效,速来炫出你的短视频开发特技!

匿名函数、冒泡排序,二分法, 递归

