seaborn 子图
Data visualizations are essential in data analysis. The famous saying “one picture is worth a thousand words” holds true in the scope of data visualizations as well. In this post, I will explain a well-structured, very informative collection of subplots: FacetGrid.
数据可视化在数据分析中至关重要。 著名的谚语“一张图片值得一千个单词”在数据可视化的范围内也是如此。 在这篇文章中,我将解释一个结构良好,内容丰富的子图集合: FacetGrid 。
FacetGrid is basically a grid of subplots. Matplotlib supports creating figures with multiple axes and thus allows to have subplots in one figure. What FacetGrid puts on top of matplotlib’s subplot structure:
FacetGrid基本上是子图的网格。 Matplotlib支持创建具有多个轴的图形,因此允许在一个图形中包含子图。 FacetGrid在matplotlib的子图结构之上放了什么:
- Making the process easier and smoother (with less code) 使过程更轻松,更流畅(使用更少的代码)
- Transfering the structure of dataset to subplots 将数据集的结构转移到子图
The distribution of a variable or relationship among variables can easily be discovered with FacetGrids. They can have up to three dimensions: row, column, and hue. It will be more clear as we go through examples. So, let’s start.
使用FacetGrids可以轻松发现变量的分布或变量之间的关系。 它们最多可以具有三个维度: row , column和hue 。 通过示例我们将更加清楚。 所以,让我们开始吧。
As always we start with importing libraries.
与往常一样,我们从导入库开始。
Note: FacetGrid requires the data stored in a pandas dataframe where each row represents an observation and columns represent variables. Thus, we also import pandas.
注意 :FacetGrid要求将数据存储在pandas数据框中,其中每一行代表一个观测值,而各列代表变量。 因此,我们也进口大熊猫。
import numpy as np
import pandas as pdimport matplotlib.pyplot as plt
import seaborn as sns
sns.set(style='darkgrid', color_codes=True)%matplotlib inline
We will use the built-in “tips” dataset of seaborn.
我们将使用seaborn的内置“提示”数据集。
tip = sns.load_dataset("tips")
tip.head()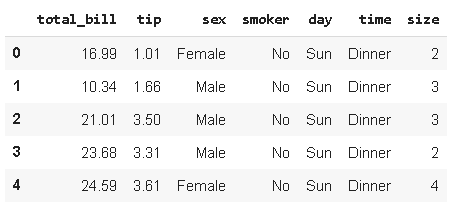
FacetGrid object is initialized by passing a dataframe and name of variables to create the structure of axes. The variables used to initialize FacetGrid object needs to be categorical or discrete. The grid structure is created according to the number of categories. For instance, “time” column has two unique values.
通过传递数据框和变量名称以创建轴的结构来初始化FacetGrid对象。 用于初始化FacetGrid对象的变量必须是分类的或离散的 。 根据类别数创建网格结构。 例如,“时间”列具有两个唯一值。
tip['time'].value_counts()
Dinner    176
Lunch      68
Name: time, dtype: int64
Let’s initialize a FacetGrid object by passing “time” variable to col parameter.
让我们通过将“ time”变量传递给col参数来初始化FacetGrid对象。
g = sns.FacetGrid(tip, col='time')
We’ve just created a very simple grid with two facets (each subplot is a facet). The size of facets are adjusted using height and aspect parameters.
我们刚刚创建了一个非常简单的带有两个小平面的网格(每个子图都是一个小平面)。 使用高度和高 宽比参数调整构面的大小。
- Height is the height of facets in inches 高度是刻面的高度,以英寸为单位
- Aspect is the ratio of width and height (width=aspect*height). Default value of aspect is 1. 宽高比是宽度与高度的比率(宽=高宽比*高)。 方面的默认值为1。
Let’s update the grid with larger facets.
让我们用更大的方面更新网格。
g = sns.FacetGrid(tip, col='time', height=5)
It is time to plot data on the grid using FacetGrid.map() method. It takes a plotting function and variable(s) to plot as arguments.
现在该使用FacetGrid.map()方法在网格上绘制数据了。 它需要一个绘图函数和一个或多个变量作为参数进行绘图。
g = sns.FacetGrid(tip, col='time', height=5)
g.map(plt.hist, "total_bill")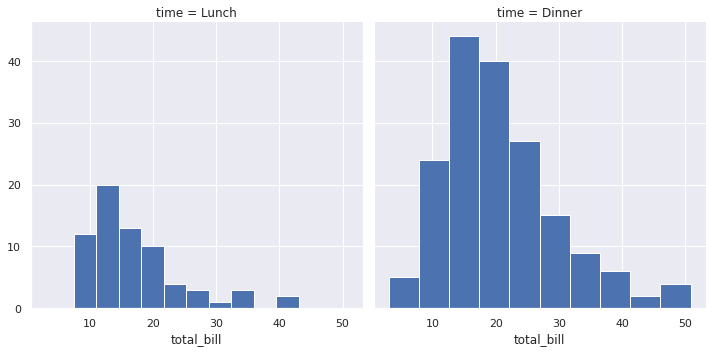
The grid shows histogram of “total_bill” based on “time”. Depending on the plotting function, we may need to pass multiple variables for map method. For instance, scatter plots require two variables.
网格显示基于“时间”的“总账单”直方图。 根据绘图功能,我们可能需要为map方法传递多个变量。 例如,散点图需要两个变量。
g = sns.FacetGrid(tip, col='time', height=5)
g.map(plt.scatter, "total_bill", "tip")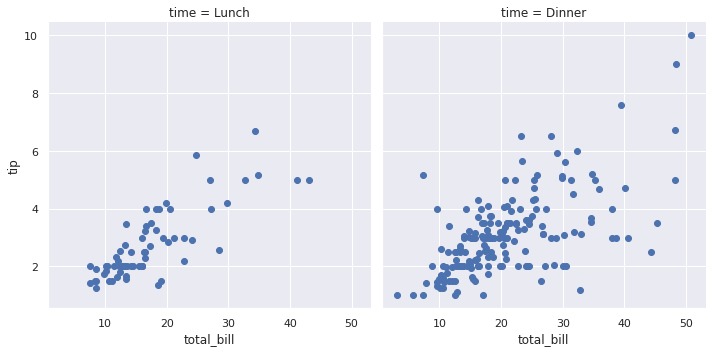
Let’s add one more dimension to the grid with row parameter.
让我们通过row参数向网格添加一个维度。
g = sns.FacetGrid(tip, row='sex', col='time', height=4)
g.map(plt.scatter, "total_bill", "tip")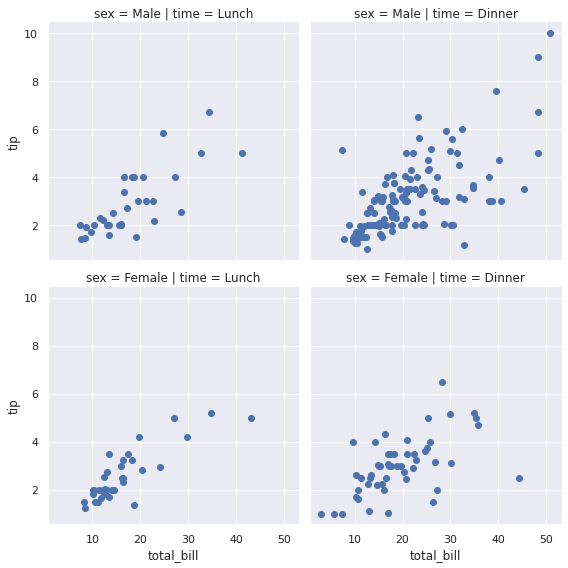
Both “sex” and “time” columns have two distinct values so a 2x2 FacetGrid is created. As we can see from the plot above, “total_bill” and “tip” variables have a similar trend for males and females.
“性别”和“时间”列都有两个不同的值,因此创建了2x2 FacetGrid。 从上图可以看出,男性和女性的“ total_bill”和“ tip”变量趋势相似。
The hue parameter allows to add one more dimension to the grid with colors.
hue参数允许使用颜色向网格添加一个维度。
g = sns.FacetGrid(tip, row='sex', col='time', hue='smoker',
                  height=4)
g.map(plt.scatter, "total_bill", "tip")
g.add_legend()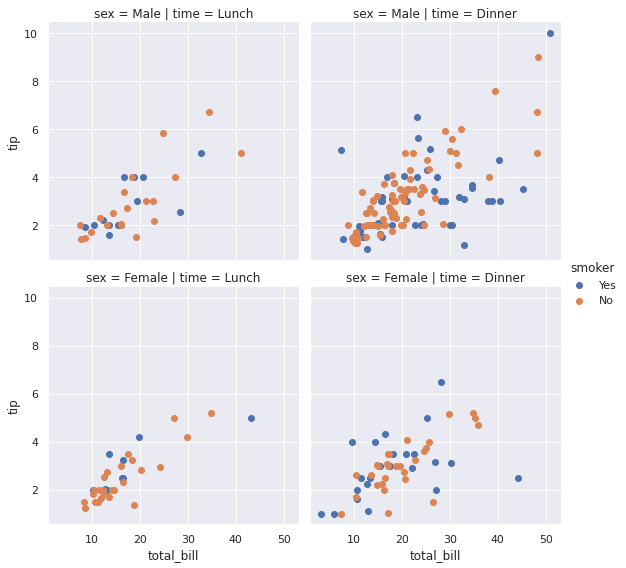
We now have an overview of the relationship among “total_bill”, “tip”, and “smoker” variables.
现在,我们对“ total_bill”,“ tip”和“ smoker”变量之间的关系进行了概述。
The “day” column has 4 unique values:
“天”列具有4个唯一值:
tip.day.value_counts()
Sat     87
Sun     76
Thur    62
Fri     19
Name: day, dtype: int64
We can create a FacetGrid that shows the distribution of “total_bill” in different days. It will show if customers spend more on any particular day.
我们可以创建一个FacetGrid来显示“ total_bill”在不同日期的分布。 它将显示客户在特定日期是否花费更多。
g = sns.FacetGrid(tip, row='day',
                  row_order = tip.day.value_counts().index,
                  height=1.5, aspect=4)g.map(sns.distplot, "total_bill", hist=False)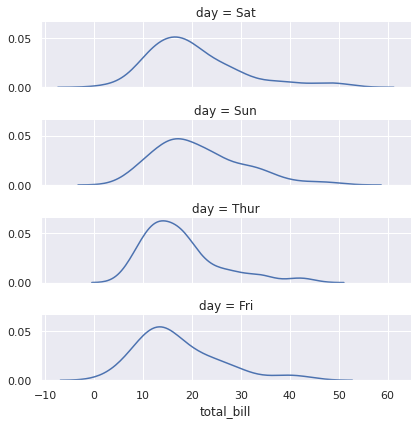
It seems like people tend to spend a little more on the weekend. We have used row_order parameter for this plot. As the name suggests, it determines the order of facets. In the previous plots, we used plotting functions from matplotlib.pyplot interface. But, for the last one, we used a plotting function from seaborn package. It is a nice feature of FacetGrid that provides additional flexibility.
人们似乎倾向于在周末花更多的钱。 我们已为此图使用row_order参数。 顾名思义,它决定了构面的顺序。 在先前的绘图中,我们使用了来自matplotlib.pyplot接口的绘图函数。 但是,对于最后一个,我们使用了seaborn包中的绘图功能。 这是FacetGrid的一项不错的功能,可提供额外的灵活性。
There are many more features that can be added on FacetGrids in order to enrich both the functionality and appearance of them. If you want to go deeper, I suggest going over seaborn documentation on FacetGrid.
可以在FacetGrids上添加更多功能,以丰富其功能和外观。 如果你想更深入,我建议去了上seaborn文档FacetGrid 。
Thank you for reading. Please let me know if you have any feedback.
感谢您的阅读。 如果您有任何反馈意见,请告诉我。
https://seaborn.pydata.org/generated/seaborn.FacetGrid.html
https://seaborn.pydata.org/Generated/seaborn.FacetGrid.html
https://seaborn.pydata.org/tutorial/axis_grids.html#grid-tutorial
https://seaborn.pydata.org/tutorial/axis_grids.html#grid-tutorial
翻译自: https://towardsdatascience.com/seaborn-facetgrid-taking-subplots-further-15ee7af54e44
seaborn 子图
本文来自互联网用户投稿,该文观点仅代表作者本人,不代表本站立场。本站仅提供信息存储空间服务,不拥有所有权,不承担相关法律责任。如若转载,请注明出处:http://www.mzph.cn/news/388072.shtml
如若内容造成侵权/违法违规/事实不符,请联系多彩编程网进行投诉反馈email:809451989@qq.com,一经查实,立即删除!——Draw2d的扩展(一))


:组合模式)


——Draw2d详解(二))


![【左偏树】【P3261】 [JLOI2015]城池攻占](http://pic.xiahunao.cn/【左偏树】【P3261】 [JLOI2015]城池攻占)


