前面是安装及上手教程,参考了彩色泡泡 和 winne雪 的博客。
如果已经写好了,可以直接跳到 问题总结。
1. npm install echarts --save
2. 在 main.js 中
import echarts from 'echarts';
Vue.prototype.$echarts = echarts;
3. 在页面上
import china from 'echarts/map/json/china.json'//注意在获取 dom 之前写:echarts.registerMap('china', chinaJson);
this.$echarts.registerMap('china', china);
具体代码:
<div style="width:400px;height:400px;" id="chinaMap" class="echart" ref="chinaMap"></div>data(){return {}},computed:{chinaMap(){ // let d = new Date();// return 'echarts' + d.getTime();return 'echarts' + Math.random() * 100000;}},methods: {randomData(){return Math.round(Math.random()*2500);},drawCharts(){this.$echarts.registerMap('china', china);var myChart = this.$echarts.init(document.getElementById(this.chinaMap));var option = {title: {text:"全国各地回收量分布",left: 'center',textStyle:{color:"#2FA7CF",fontSize: 22}},tooltip: {trigger: 'item',// formatter详细配置: https://echarts.baidu.com/option.html#tooltip.formatterformatter (params, ticket, callback){let localValue = 0;if (params.data){localValue = params.data.value;} let htmlStr = `<div>${params.data.name}省回收量:${localValue}</div>`return htmlStr;}},visualMap: {min: 0,max: 2500,left: 'left',top: 'bottom',text: ['高','低'], // 文本,默认为数值文本calculable: false,color:['#FF0000','#84CDFC'],itemWidth: 16,itemHeight: 113,textStyle:{color: '#fff'}},// geo:{ // map: 'china',// zoom:1.2,// aspectScale:.75,// label:{// show:true// },// itemStyle: { // 地图区域的多边形 图形样式。// borderColor: 'rgba(0, 0, 0, 0.2)',// emphasis: { // 高亮状态下的多边形和标签样式// shadowBlur: 20,// shadowColor: 'rgba(0, 0, 0, 0.5)'// }// }// },series: [{name: '',type: 'map',mapType: 'china',roam: false,// geoIndex: 1, // zoom: 1.2, //不兼容ie// aspectScale:0.75,left: '1%',right:0,top:30,bottom:0,label: {normal: {show: true},emphasis: {show: true}},data:this.data}]};myChart.setOption(option);window.addEventListener('resize',function() {myChart.resize()}); //控制浏览器缩放时正常显示}},mounted(){this.drawCharts();}
地图在 ie 浏览器上不显示的几个原因:
1. 使用了 zoom 缩放属性。

2. echart 的版本问题。
3. html 页面未添加 <meta http-equiv="X-UA-Compatible" content="IE=edge"/>。
4. 配置项完成后以 , 结尾。 配置项中每个条件结束后,后面不要 ,。
因为不加缩放 zoom ,地图显示得太小了,所以在 series 中添加了 left right top等属性,它会对地图做出相应的拉升达到效果。

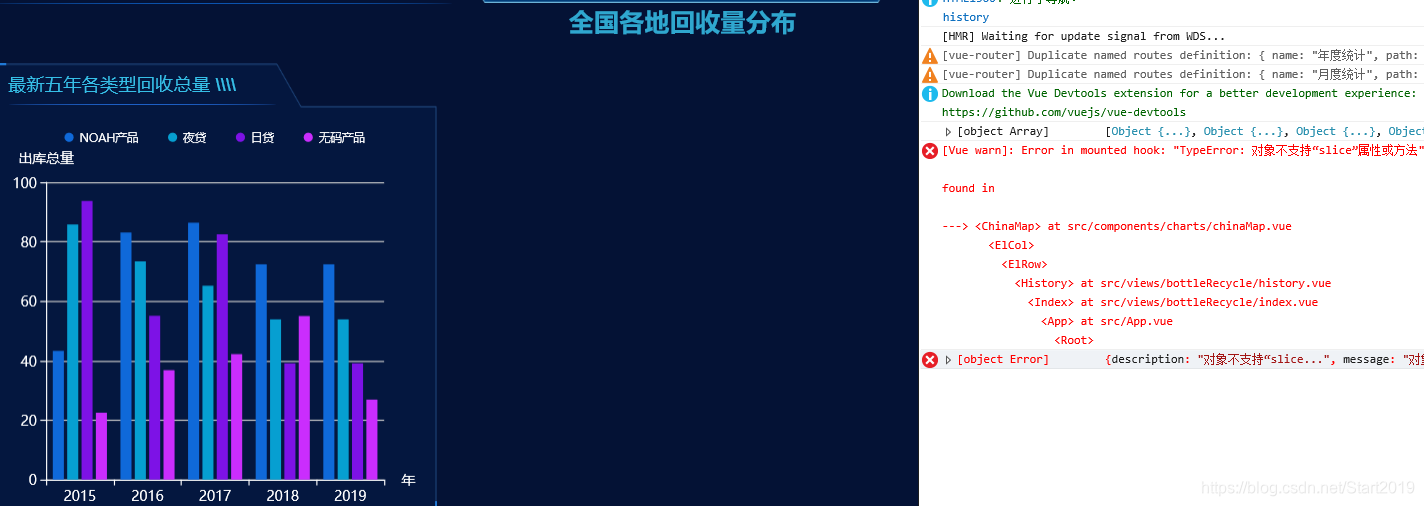
最后实现了想要的效果:


)


![WMI in C#[强类型操作]](http://pic.xiahunao.cn/WMI in C#[强类型操作])