数据地址:DCRNN - Google 云端硬盘
各station 位置:DCRNN/data/sensor_graph/graph_sensor_locations_bay.csv at master · liyaguang/DCRNN (github.com)
1 读取 数据
import h5py
file='Downloads/pems-bay.h5'f=h5py.File(file,'r')
f.keys()f['speed']
#<HDF5 group "/speed" (4 members)>
#说明speed是一个group,不是datasetf['speed'].keys()
#<KeysViewHDF5 ['axis0', 'axis1', 'block0_items', 'block0_values']>
f['speed']['axis0'][:].shape,f['speed']['axis0'][:]
'''
((325,),array([400001, 400017, 400030, 400040, 400045, 400052, 400057, 400059,400065, 400069, 400073, 400084, 400085, 400088, 400096, 400097,400100, 400104, 400109, 400122, 400147, 400148, 400149, 400158,
'''f['speed']['block0_items'][:].shape,f['speed']['axis0'][:]
'''
((325,),array([400001, 400017, 400030, 400040, 400045, 400052, 400057, 400059,400065, 400069, 400073, 400084, 400085, 400088, 400096, 400097,400100, 400104, 400109, 400122, 400147, 400148, 400149, 400158,
'''#这两个是一样的,都是station的idf['speed']['axis1'][:].shape,f['speed']['axis1'][:]
'''
((52116,),array([1483228800000000000, 1483229100000000000, 1483229400000000000, ...,1498866300000000000, 1498866600000000000, 1498866900000000000],dtype=int64))
'''#时间import pandas as pddatetimes=pd.to_datetime(f['speed']['axis1'][:])
datetimes
'''
DatetimeIndex(['2017-01-01 00:00:00', '2017-01-01 00:05:00','2017-01-01 00:10:00', '2017-01-01 00:15:00','2017-01-01 00:20:00', '2017-01-01 00:25:00','2017-01-01 00:30:00', '2017-01-01 00:35:00','2017-01-01 00:40:00', '2017-01-01 00:45:00',...'2017-06-30 23:10:00', '2017-06-30 23:15:00','2017-06-30 23:20:00', '2017-06-30 23:25:00','2017-06-30 23:30:00', '2017-06-30 23:35:00','2017-06-30 23:40:00', '2017-06-30 23:45:00','2017-06-30 23:50:00', '2017-06-30 23:55:00'],dtype='datetime64[ns]', length=52116, freq=None)
'''f['speed']['block0_values'][:].shape,f['speed']['block0_values'][:]
'''
((52116, 325),array([[71.4, 67.8, 70.5, ..., 68.8, 71.1, 68. ],[71.6, 67.5, 70.6, ..., 68.4, 70.8, 67.4],[71.6, 67.6, 70.2, ..., 68.4, 70.5, 67.9],...,[71.4, 66.9, 68.1, ..., 68.4, 71.6, 66.6],[72.2, 66.5, 68. , ..., 68.7, 71.6, 68.4],[71.5, 66.2, 68.4, ..., 68.7, 71.6, 68. ]]))
'''每个时刻的速度了2 station位置可视化
2.1 读取数据
import pandas as pd
df=pd.read_csv('Downloads/graph_sensor_locations_bay.csv',names=['station_id','lat','lon'])
df
2.2 找到经纬度的平均点
mean_lat=df['lat'].mean()
mean_lon=df['lon'].mean()
mean_lat,mean_lon
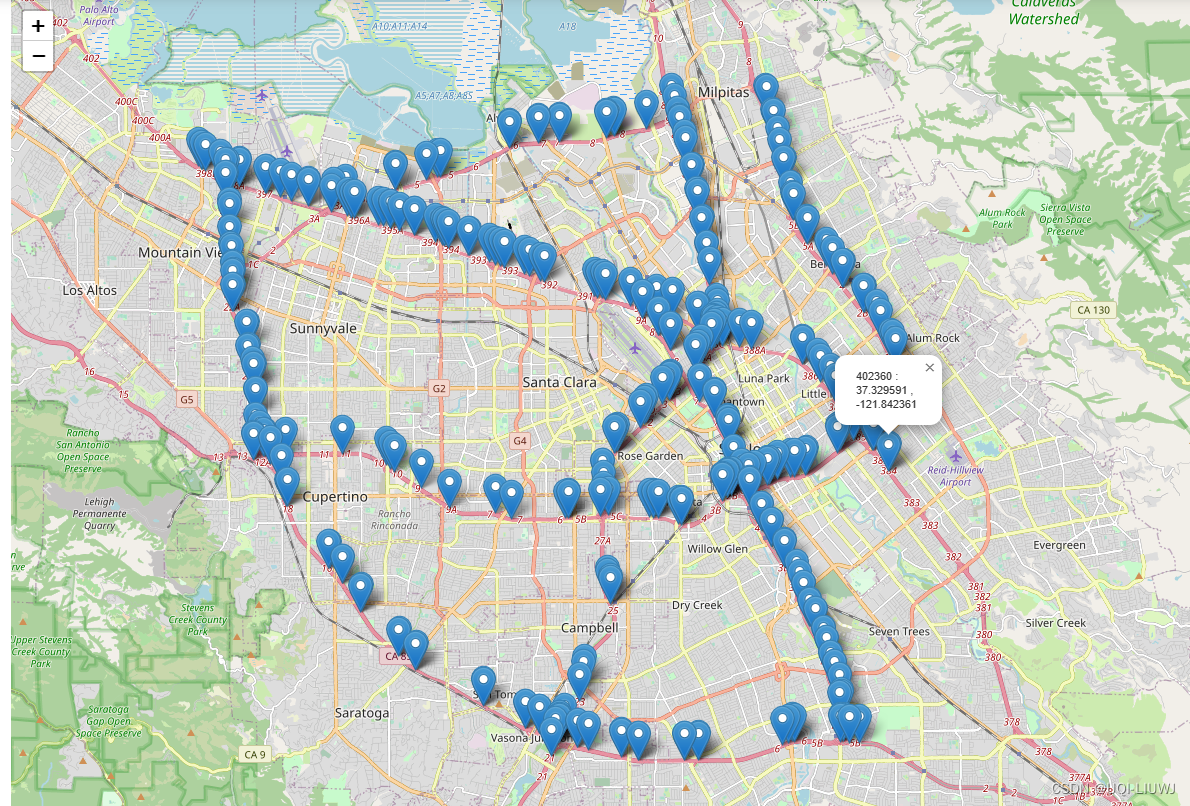
2.3 画图,每个station一个marker,同时点开这个station会弹出对应的station id,和经纬度
import foliumm=folium.Map(location=(mean_lat,mean_lon),zoom_start=12)for i in df.iterrows():#print(i)tmp_lat=i[1]['lat']tmp_lon=i[1]['lon']tmp_id=i[1]['station_id']#print(tmp_lat,tmp_lon)folium.Marker(location=(tmp_lat,tmp_lon),popup=str(int(tmp_id))+' : '+str(tmp_lat)+' , '+str(tmp_lon)).add_to(m)
m

)


)
)


)


)


