目录
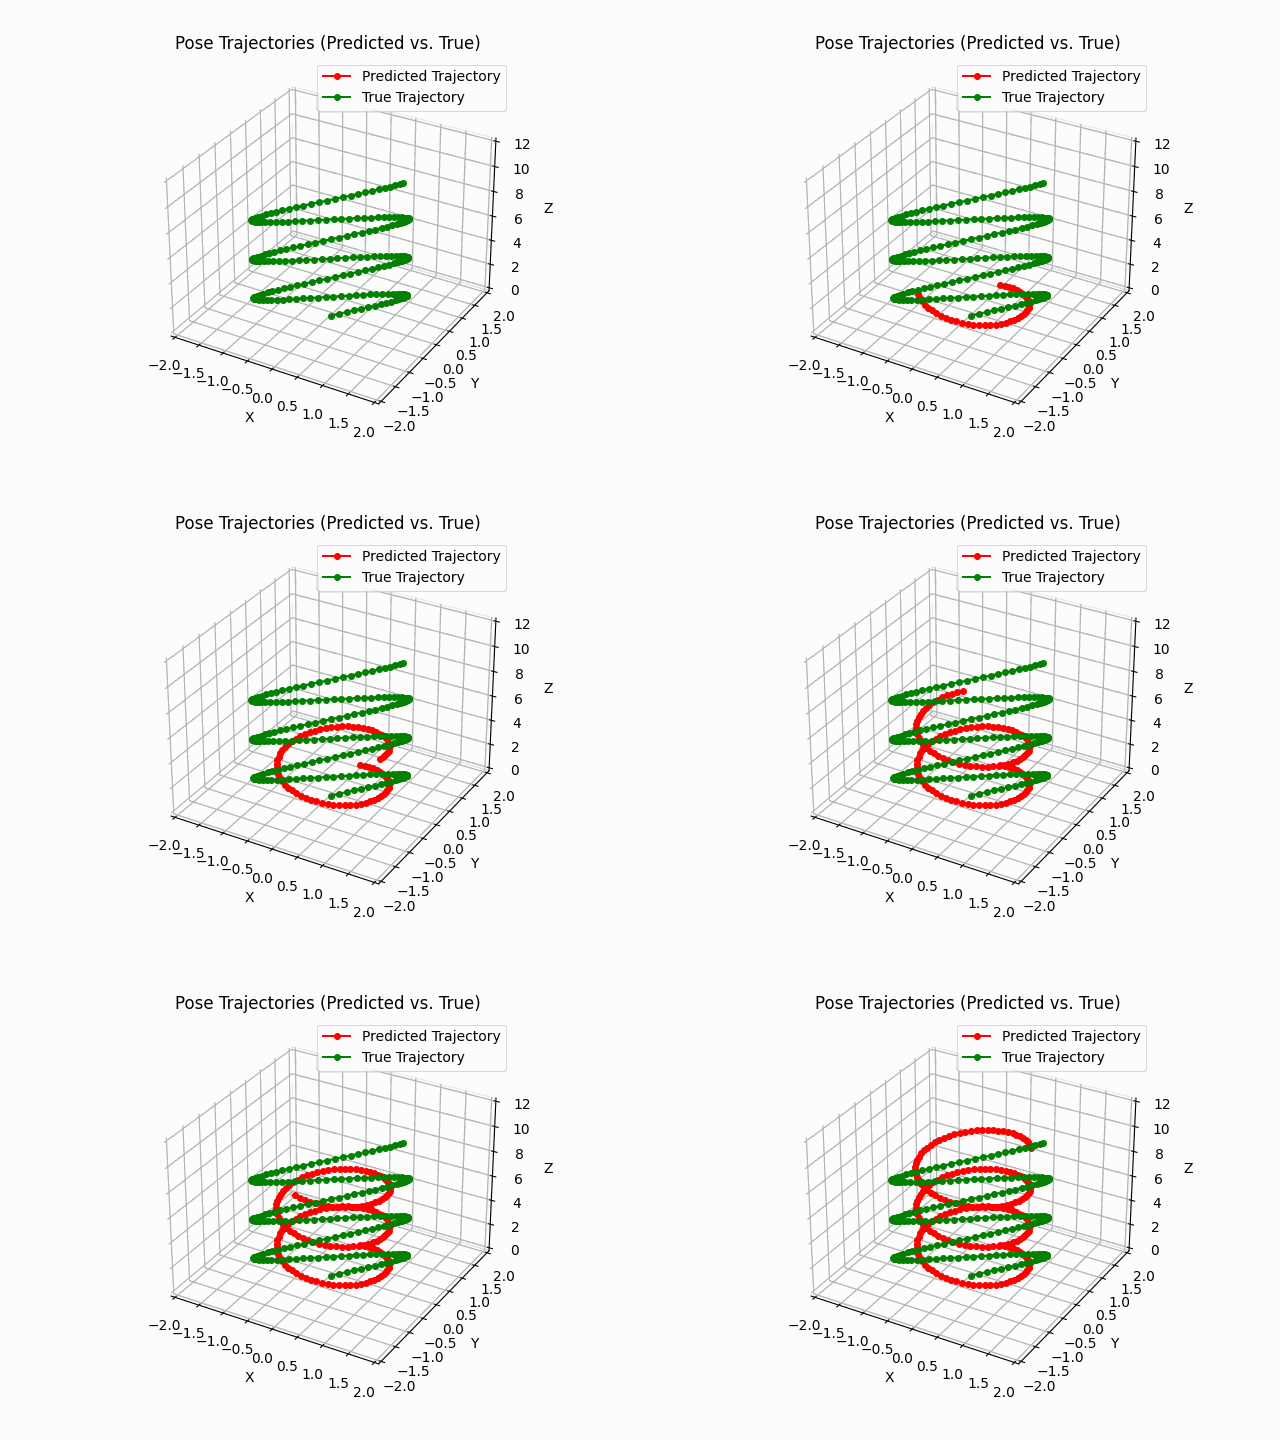
1. 预测的3D轨迹和实际轨迹的动画图,同时动态更新
2 真值轨迹设置为静态的,预测轨迹不断更新
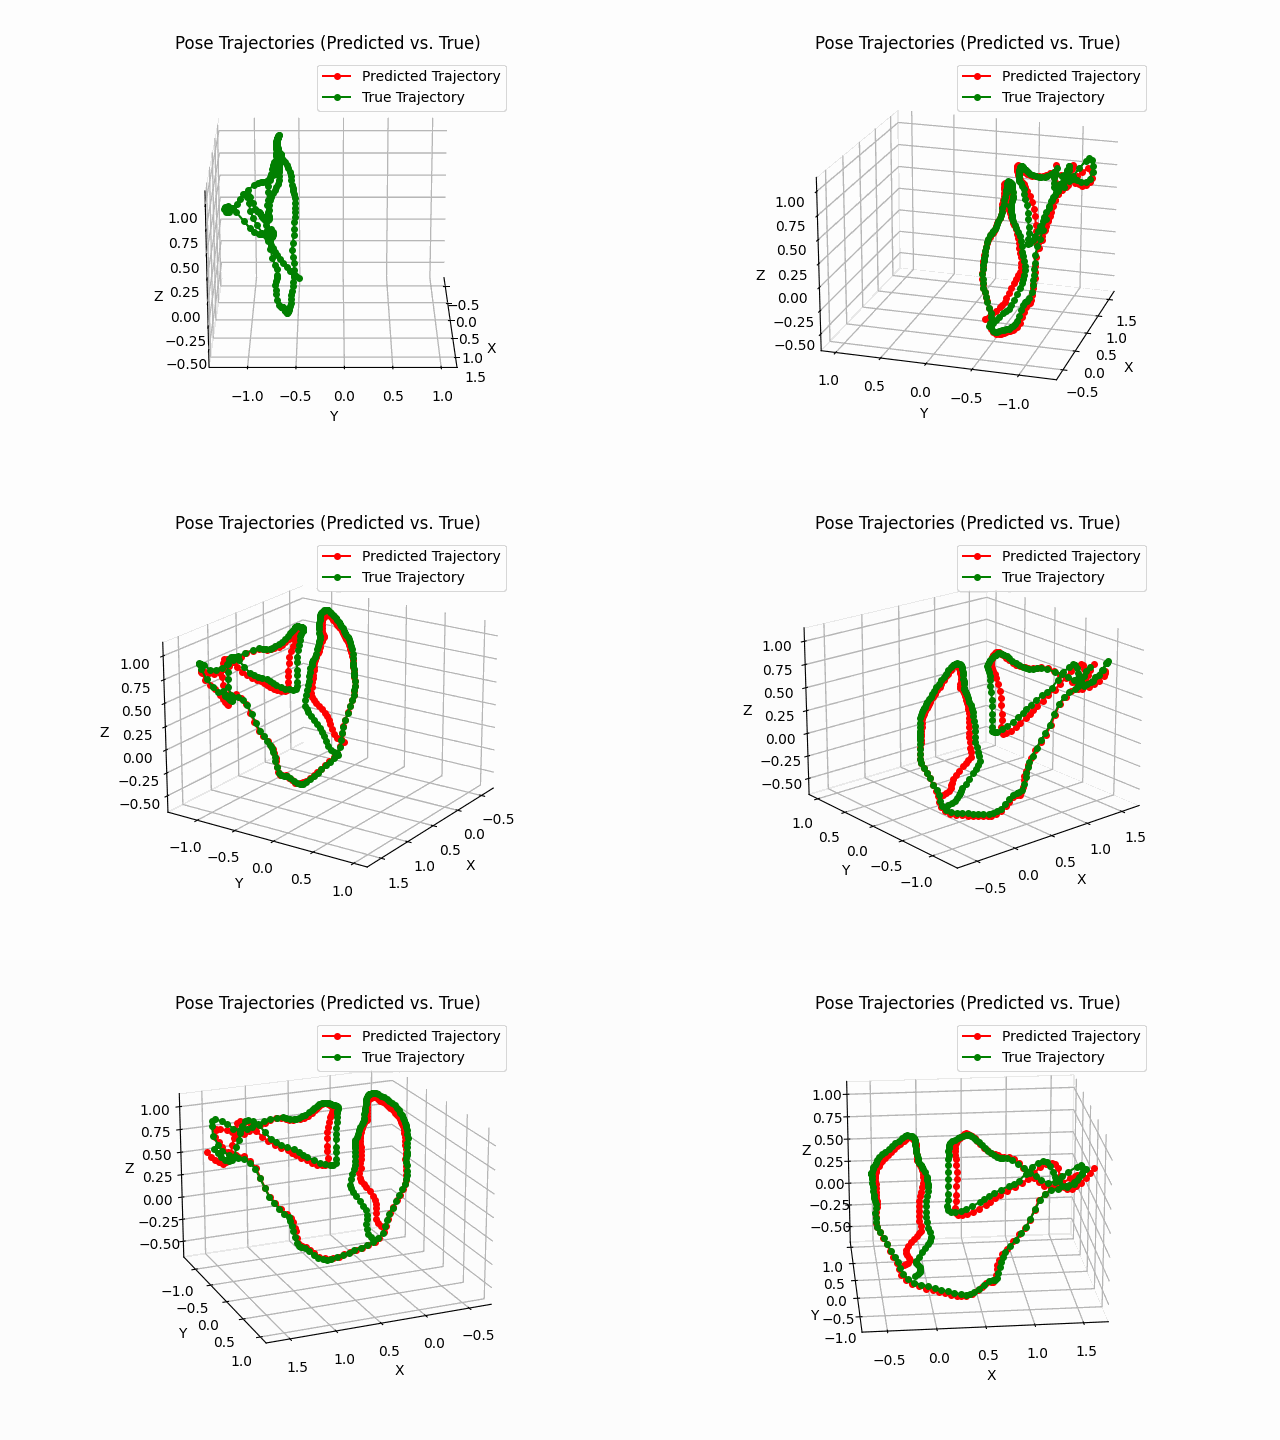
3 网格的三维坐标系有旋转运动,以此全方位展示预测轨迹和真值轨迹之间的空间关系
1. 预测的3D轨迹和实际轨迹的动画图,同时动态更新
import numpy as np
import matplotlib.pyplot as plt
from mpl_toolkits.mplot3d import Axes3D
from matplotlib.animation import FuncAnimation, PillowWriter# 假设您有两组连续平滑的姿势数据集,一组表示预测值,一组表示真值
# 每个数据点包含姿势信息 [x, y, z, roll, pitch, yaw]
# 这里使用一些示例数据,您需要替换为您的实际数据
num_poses = 200  # 增加轨迹点数
t = np.linspace(0, 20, num_poses)  # 时间点,使轨迹变得更长
# 生成示例数据来表示预测值轨迹
x_pred = np.sin(t)
y_pred = np.cos(t)
z_pred = np.linspace(0, 10, num_poses)
# 生成示例数据来表示真值轨迹
x_true = np.sin(t) + 0.5  # 真值轨迹稍微偏移
y_true = np.cos(t) + 0.5
z_true = np.linspace(0, 10, num_poses)# 创建一个 3D 图形
fig = plt.figure()
ax = fig.add_subplot(111, projection='3d')# 创建空的轨迹线,一个红色表示预测值,一个蓝色表示真值
line_pred, = ax.plot([], [], [], marker='o', linestyle='-', markersize=4, color='red', label='Predicted Trajectory')
line_true, = ax.plot([], [], [], marker='o', linestyle='-', markersize=4, color='green', label='True Trajectory')# 设置图形标题和轴标签
ax.set_title('Pose Trajectories (Predicted vs. True)')
ax.set_xlabel('X')
ax.set_ylabel('Y')
ax.set_zlabel('Z')# 添加图例
ax.legend(loc='upper right')# 初始化函数,用于绘制空轨迹线
def init():line_pred.set_data([], [])line_pred.set_3d_properties([])line_true.set_data([], [])line_true.set_3d_properties([])return line_pred, line_true# 更新函数,用于更新轨迹线的数据
def update(frame):line_pred.set_data(x_pred[:frame], y_pred[:frame])line_pred.set_3d_properties(z_pred[:frame])line_true.set_data(x_true[:frame], y_true[:frame])line_true.set_3d_properties(z_true[:frame])# 扩大坐标范围,以包围轨迹ax.set_xlim(min(x_true) - 1, max(x_true) + 1)ax.set_ylim(min(y_true) - 1, max(y_true) + 1)ax.set_zlim(min(z_true) - 1, max(z_true) + 1)return line_pred, line_true# 创建动画对象
ani = FuncAnimation(fig, update, frames=num_poses, init_func=init, blit=True)# 创建一个文件名为animation.gif的视频文件,使用PillowWriter
ani.save('animation_gt.gif', writer=PillowWriter(fps=30))# 显示动画
plt.show()

2 真值轨迹设置为静态的,预测轨迹不断更新
import numpy as np
import matplotlib.pyplot as plt
from mpl_toolkits.mplot3d import Axes3D
from matplotlib.animation import FuncAnimation, PillowWriter# 假设您有两组连续平滑的姿势数据集,一组表示预测值,一组表示真值
# 每个数据点包含姿势信息 [x, y, z, roll, pitch, yaw]
# 这里使用一些示例数据,您需要替换为您的实际数据
num_poses = 200  # 增加轨迹点数
t = np.linspace(0, 20, num_poses)  # 时间点,使轨迹变得更长
# 生成示例数据来表示预测值轨迹
x_pred = np.sin(t)
y_pred = np.cos(t)
z_pred = np.linspace(0, 10, num_poses)
# 生成示例数据来表示真值轨迹
x_true = np.sin(t) + np.random.uniform(-0.2, 0.3)  # 真值轨迹稍微偏移
y_true = np.sin(t) + np.random.uniform(-0.2, 0.3)  # 真值轨迹稍微偏移
z_true = np.linspace(0, 10, num_poses)# 创建一个 3D 图形
fig = plt.figure()
ax = fig.add_subplot(111, projection='3d')# 创建空的轨迹线,一个红色表示预测值,一个绿色表示真值
line_pred, = ax.plot([], [], [], marker='o', linestyle='-', markersize=4, color='red', label='Predicted Trajectory')
line_true, = ax.plot(x_true, y_true, z_true, marker='o', linestyle='-', markersize=4, color='green', label='True Trajectory')# 设置图形标题和轴标签
ax.set_title('Pose Trajectories (Predicted vs. True)')
ax.set_xlabel('X')
ax.set_ylabel('Y')
ax.set_zlabel('Z')# 添加图例
ax.legend(loc='upper right')# 设置轨迹显示范围
ax.set_xlim(-2, 2)  # X轴范围
ax.set_ylim(-2, 2)  # Y轴范围
ax.set_zlim(0, 12)  # Z轴范围# 初始化函数,用于绘制空轨迹线
def init():line_pred.set_data([], [])line_pred.set_3d_properties([])return line_pred, line_true# 更新函数,用于更新预测轨迹的数据
def update(frame):line_pred.set_data(x_pred[:frame], y_pred[:frame])line_pred.set_3d_properties(z_pred[:frame])return line_pred, line_true# 创建动画对象
ani = FuncAnimation(fig, update, frames=num_poses, init_func=init, blit=True)# 创建一个文件名为animation.gif的视频文件,使用PillowWriter
ani.save('animation_1.gif', writer=PillowWriter(fps=30))# 显示动画
plt.show()

3 网格的三维坐标系有旋转运动,以此全方位展示预测轨迹和真值轨迹之间的空间关系
import numpy as np
import matplotlib.pyplot as plt
from mpl_toolkits.mplot3d import Axes3D
from matplotlib.animation import FuncAnimation, PillowWriter# 假设您有两组连续平滑的姿势数据集,一组表示预测值,一组表示真值
# 每个数据点包含姿势信息 [x, y, z, roll, pitch, yaw]
# 这里使用一些示例数据,您需要替换为您的实际数据
num_poses = 200  # 增加轨迹点数
t = np.linspace(0, 20, num_poses)  # 时间点,使轨迹变得更长
# 生成示例数据来表示预测值轨迹
x_pred = np.sin(t)
y_pred = np.cos(t)
z_pred = np.linspace(0, 10, num_poses)
# 生成示例数据来表示真值轨迹
x_true = np.sin(t) + 0.5  # 真值轨迹稍微偏移
y_true = np.cos(t) + 0.5
z_true = np.linspace(0, 10, num_poses)# 创建一个 3D 图形
fig = plt.figure()
ax = fig.add_subplot(111, projection='3d')# 创建空的轨迹线,一个红色表示预测值,一个蓝色表示真值
line_pred, = ax.plot([], [], [], marker='o', linestyle='-', markersize=4, color='red', label='Predicted Trajectory')
line_true, = ax.plot(x_true, y_true, z_true, marker='o', linestyle='-', markersize=4, color='blue', label='True Trajectory')# 设置图形标题和轴标签
ax.set_title('Pose Trajectories (Predicted vs. True)')
ax.set_xlabel('X')
ax.set_ylabel('Y')
ax.set_zlabel('Z')# 添加图例
ax.legend(loc='upper right')# 设置轨迹显示范围
ax.set_xlim(-2, 2)  # X轴范围
ax.set_ylim(-2, 2)  # Y轴范围
ax.set_zlim(0, 12)  # Z轴范围# 初始化函数,用于绘制空轨迹线
def init():line_pred.set_data([], [])line_pred.set_3d_properties([])return line_pred, line_true# 更新函数,用于更新预测轨迹的数据和整体的旋转运动
def update(frame):line_pred.set_data(x_pred[:frame], y_pred[:frame])line_pred.set_3d_properties(z_pred[:frame])# 添加整体的旋转运动ax.view_init(elev=20, azim=frame)  # 调整视角,azim控制旋转return line_pred, line_true# 创建动画对象
ani = FuncAnimation(fig, update, frames=num_poses, init_func=init, blit=True)# 创建一个文件名为animation.gif的视频文件,使用PillowWriter
ani.save('animation.gif', writer=PillowWriter(fps=30))# 显示动画
plt.show()

更新函数中使用了
ax.view_init来控制整体的旋转运动,elev参数用于调整仰角,azim参数用于控制旋转。您可以根据需要调整elev和azim的值来实现所需的旋转效果。


![[JAVAee]Spring MVC](http://pic.xiahunao.cn/[JAVAee]Spring MVC)
)
:PyTorch数据结构:4、数据集(Dataset))


