一、背景介绍
这个竞赛的焦点是预测机器是否会在未来24小时内故障。数据包括与机器性能相关的各种特征,例如温度、振动、功耗和传感器读数。目标变量是二进制的,表示机器是否在未来24小时内故障(1)或未故障(0)。这个竞赛的目标是开发准确的模型,可以根据提供的特征预测机器故障。这是一个重要的问题,在工业环境中,提前预测机器故障可以帮助防止昂贵的停机时间和维修。要参加这个竞赛,您可以使用任何您选择的机器学习方法。然而,请注意,数据集只包含数值特征,因此基于文本的特征工程技术可能不适用。另外,请确保在训练您的模型之前适当处理缺失值。祝您好运并享受解决这个有趣问题的过程。
官方链接:Binary Classification of Machine Failures
数据集介绍:
数据说明如下表所示:包含如下信息及对应信息的解释
| 列标题 | 列说明 |
|---|---|
| id | 唯一标识符,用于索引和引用每个记录 |
| Product Id | Type 变量后跟一个标识符编号的组合 |
| Type | 记录的类型。了解机器类型可以提供有关其操作的见解,从而可以将其与故障概率联系起来 |
| Air Temperature [K] | 机器周围环境的温度,以开尔文为单位。可能会影响不同环境条件下机器的行为 |
| Process Temperature [K] | 机器所处过程中的温度,以开尔文为单位。某些过程可能会导致机器过热和故障的可能性增加 |
| Rotational Speed [rpm] | 机器的运行速度,以每分钟转数 (rpm) 为单位。更高的速度可能会导致磨损加剧 |
| Torque [Nm] | 引起机器旋转的力,以牛顿米 (Nm) 表示。更高的扭矩可能表明更高的负载和更大的故障风险 |
| Tool Wear [min] | 机器经历的磨损程度,以分钟为单位。较高的工具磨损可能表明需要进行维护 |
| Machine Failure | 目标变量:指示机器是否失败(1)或未失败(0)的二进制指示器 |
| TWF | 工具磨损导致的机器故障 |
| HDF | 由于热能不足而导致的机器故障 |
| PWF | 由于电力相关问题而导致的机器故障 |
| OSF | 由于过度紧张而导致的机器故障 |
| RNF | 由于未指定的随机问题而导致的机器故障 |
统计指标AUC:
AUC是ROC曲线下的面积,是一个模型评价指标,只能够用于二分类模型的评价。AUC的值越大代表模型分类正确的可能性越大 。AUC的概率性解释为:“AUC是模型对随机选择的正类评分高于随机选择的负类的概率”。
from sklearn.metrics import roc_auc_score
y_true = [0, 1, 0, 1]
y_scores = [0.1, 0.4, 0.35, 0.8]
auc = roc_auc_score(y_true, y_scores)
print(auc)
二、数据加载
# 训练数据
train = pd.read_csv("./data/train.csv")
train.head() # 查看前五行
| ID | Product ID | Type | Air temperature [K] | Process temperature [K] | Rotational speed [rpm] | Torque [Nm] | Tool wear [min] | Machine failure | TWF | HDF | PWF | OSF | RNF |
|---|---|---|---|---|---|---|---|---|---|---|---|---|---|
| 0 | 0 | L50096 | 300.6 | 309.6 | 1596 | 36.1 | 140 | 0 | 0 | 0 | 0 | 0 | 0 |
| 1 | 1 | M20343 | 302.6 | 312.1 | 1759 | 29.1 | 200 | 0 | 0 | 0 | 0 | 0 | 0 |
| 2 | 2 | L49454 | 299.3 | 308.5 | 1805 | 26.5 | 25 | 0 | 0 | 0 | 0 | 0 | 0 |
| 3 | 3 | L53355 | 301.0 | 310.9 | 1524 | 44.3 | 197 | 0 | 0 | 0 | 0 | 0 | 0 |
| 4 | 4 | M24050 | 298.0 | 309.0 | 1641 | 35.4 | 34 | 0 | 0 | 0 | 0 | 0 | 0 |
# 查看列所表达的意思
train.columns
Index(['id', 'Product ID', 'Type', 'Air temperature [K]','Process temperature [K]', 'Rotational speed [rpm]', 'Torque [Nm]','Tool wear [min]', 'Machine failure', 'TWF', 'HDF', 'PWF', 'OSF','RNF'],dtype='object')
# 查看所有信息
train.info()
<class 'pandas.core.frame.DataFrame'>
RangeIndex: 136429 entries, 0 to 136428
Data columns (total 14 columns):#   Column                   Non-Null Count   Dtype
---  ------                   --------------   -----  0   id                       136429 non-null  int64  1   Product ID               136429 non-null  object 2   Type                     136429 non-null  object 3   Air temperature [K]      136429 non-null  float644   Process temperature [K]  136429 non-null  float645   Rotational speed [rpm]   136429 non-null  int64  6   Torque [Nm]              136429 non-null  float647   Tool wear [min]          136429 non-null  int64  8   Machine failure          136429 non-null  int64  9   TWF                      136429 non-null  int64  10  HDF                      136429 non-null  int64  11  PWF                      136429 non-null  int64  12  OSF                      136429 non-null  int64  13  RNF                      136429 non-null  int64
dtypes: float64(3), int64(9), object(2)
memory usage: 14.6+ MB
# 查看数据分布train.describe() 用于描述数据集的统计信息的方法。它返回数据集中的数值型列的相关信息,如计数、均值、标准差、最小值、四分位数和最大值
train.describe()

# 查看数据集中缺失值数量,返回数据集中每列的缺失值数量的总和
train.isna().sum()
id 0
Product ID 0
Type 0
Air temperature [K] 0
Process temperature [K] 0
Rotational speed [rpm] 0
Torque [Nm] 0
Tool wear [min] 0
Machine failure 0
TWF 0
HDF 0
PWF 0
OSF 0
RNF 0
dtype: int64
# 测试集
test = pd.read_csv("./data/test.csv")
test

# 重新调整列表的索引,因为machine failure不在最后一列
train = train.reindex(columns=["id",'Product ID','Type',"Air temperature [K]","Process temperature [K]","Rotational speed [rpm]","Torque [Nm]","Tool wear [min]","TWF","HDF","PWF","OSF","RNF","Machine failure"])
train

三、数据分析
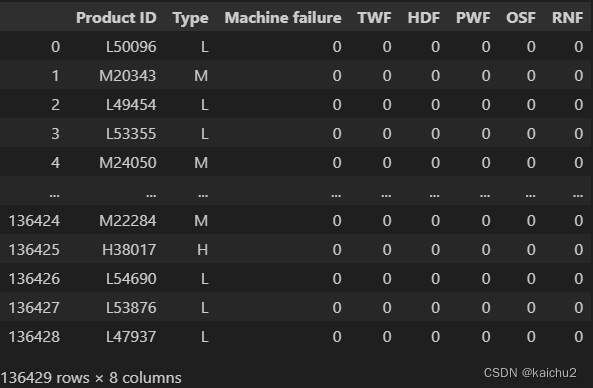
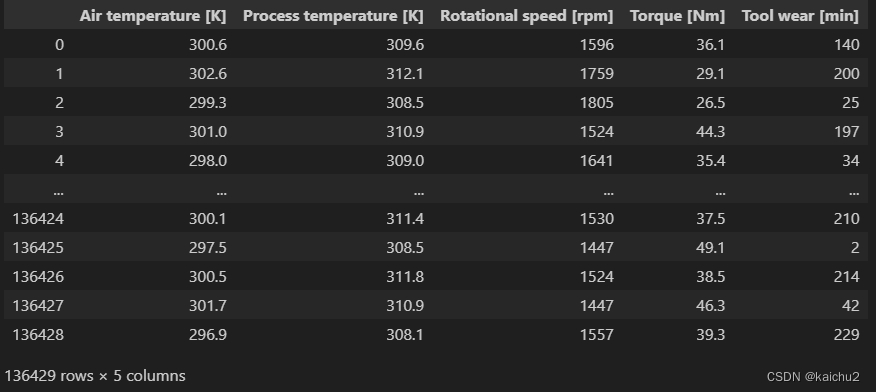
# 类别特征
categorical_features = train[['Product ID', 'Type', 'Machine failure', 'TWF', 'HDF','PWF', 'OSF','RNF']]# 总的特征数
num_features = train[['Air temperature [K]', 'Process temperature [K]', 'Rotational speed [rpm]', 'Torque [Nm]','Tool wear [min]']]
categorical_features
num_features
四、数据处理
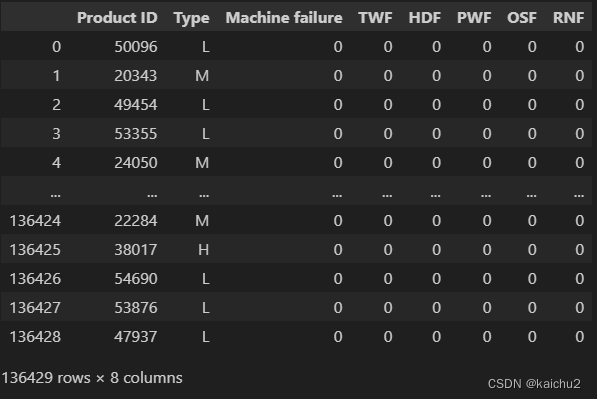
# 使用Python中的str.maketrans()方法创建一个翻译表,该表将字母映射为空字符。然后,
# 它使用translate()方法将输入字符串中的每个字母替换为相应的空字符。最后,它返回结果字符串。
def remove_letters(input_string):translation_table = str.maketrans('', '', 'abcdefghijklmnopqrstuvwxyzABCDEFGHIJKLMNOPQRSTUVWXYZ')result_string = input_string.translate(translation_table)return result_string
# eg:
# input_string = "Hello, World!"
# result_string = remove_letters(input_string)
# print(result_string)  # 输出: ", !"# 主要去除product id中的字母
cleaned_column = [remove_letters(value) for value in train['Product ID']]
cleaned_column_test = [remove_letters(value) for value in test['Product ID']]train['Product ID'] = cleaned_column
test['Product ID'] = cleaned_column_test
train

cleaned_cat_features = [remove_letters(value) for value in categorical_features['Product ID']]
categorical_features['Product ID'] = cleaned_cat_features
categorical_features
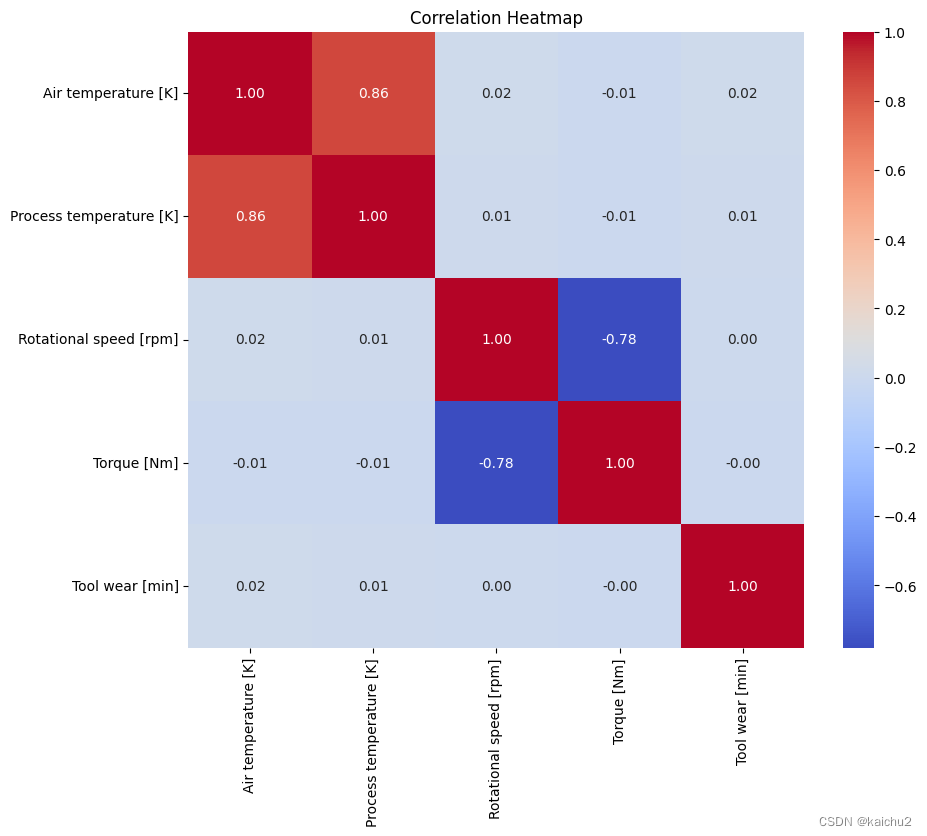
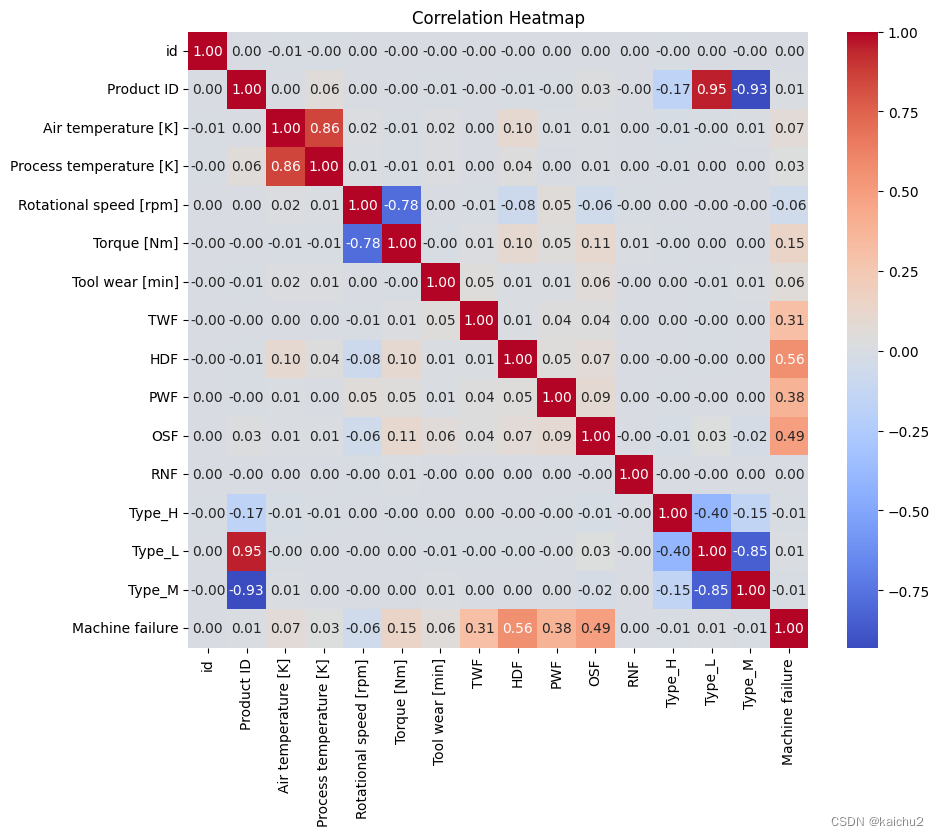
使用 Pandas 库中的 corr() 函数来计算数据集中各个列之间的相关系数。相关系数衡量了两个变量之间的线性关系强度和方向。相关系数的取值范围在 -1 到 1 之间,其中 -1 表示完全负相关,1 表示完全正相关,0 表示无相关性。
生成的相关系数矩阵将包含每个列与其他列之间的相关系数。这个矩阵可以用于分析数据集中不同变量之间的关系,例如检查是否存在某些变量之间的高度相关性,或者评估变量对目标变量的影响程度。
# 计算相似矩阵:数据中必须都是数字形式
corr_matrix = num_features.corr()
fig, ax = plt.subplots(figsize=(10, 8))
sns.heatmap(corr_matrix,annot=True,fmt=".2f",cmap="coolwarm",square=True,ax=ax)
plt.title("Correlation Heatmap")
plt.show()
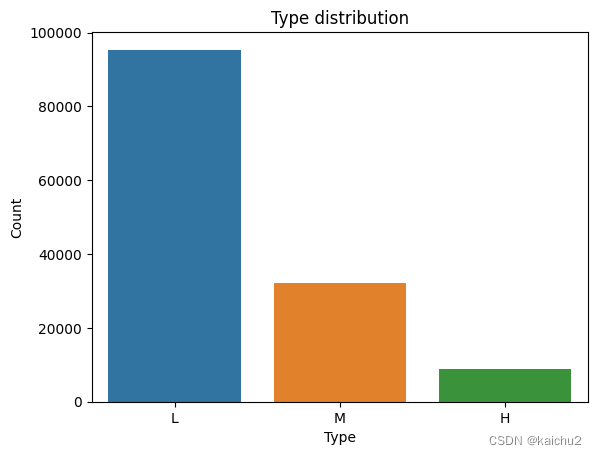
# 查看不同类型下有多少机器
# 从下图可以看出主要三种类型,L类型占据最多
type_counts = categorical_features["Type"].value_counts()
sns.barplot(x=type_counts.index,y=type_counts.values)
plt.title("Type distribution")
plt.xlabel("Type")
plt.ylabel("Count")
plt.show()
test

from sklearn.preprocessing import OneHotEncoder
One_hot_encoder = OneHotEncoder()# 通过上面查看Type的分布,对train中的Type进行编码处理
encoded_type = One_hot_encoder.fit_transform(train[["Type"]]).toarray()
# Create a DataFrame with encoded values
encoded_df = pd.DataFrame(encoded_type, columns=One_hot_encoder.get_feature_names_out(['Type']))
# Concatenate encoded_df with df_train
train_encoded = pd.concat([train, encoded_df], axis=1)
train_encoded.drop('Type', axis=1, inplace=True)
train_encoded

# Transform 'Type' column in df_test
encoded_type = One_hot_encoder.fit_transform(test[['Type']]).toarray()# Create a DataFrame with encoded values
encoded_test = pd.DataFrame(encoded_type, columns=One_hot_encoder.get_feature_names_out(['Type']))
encoded_test = encoded_test.set_index(test.index) # I've to set the index because the test dataframe doesn't start in id 0# Concatenate encoded_df with df_train
test_encoded = pd.concat([test, encoded_test], axis=1)test_encoded.drop('Type', axis=1, inplace=True)
test_encoded

train_encoded = train_encoded.reindex(columns=['id', 'Product ID', 'Air temperature [K]', 'Process temperature [K]','Rotational speed [rpm]', 'Torque [Nm]', 'Tool wear [min]', 'TWF','HDF', 'PWF', 'OSF', 'RNF', 'Type_H', 'Type_L','Type_M','Machine failure'])
train_encoded

test_encoded

from sklearn.preprocessing import StandardScaler
# 特征归一化
sc = StandardScaler()
# Select the numeric columns for standardization
train_numeric_columns = ['Air temperature [K]', 'Process temperature [K]', 'Rotational speed [rpm]', 'Torque [Nm]', 'Tool wear [min]']
train_encoded[train_numeric_columns] = sc.fit_transform(train_encoded[train_numeric_columns])
num_features = train_encoded[train_numeric_columns]# Select the numeric columns for standardization
test_numeric_columns = ['Air temperature [K]', 'Process temperature [K]', 'Rotational speed [rpm]', 'Torque [Nm]', 'Tool wear [min]']
test_encoded[test_numeric_columns] = sc.fit_transform(test_encoded[test_numeric_columns])# 查看训练集中的数据分布
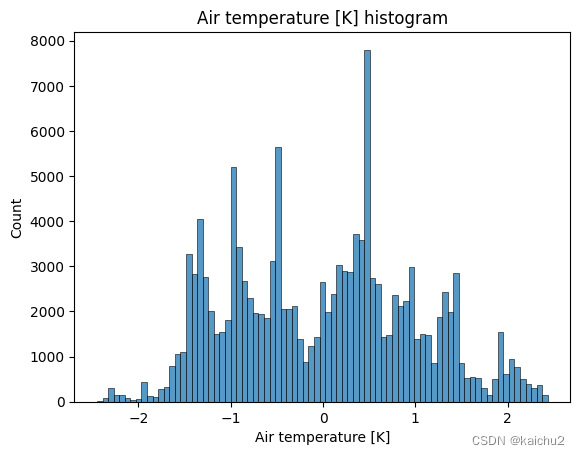
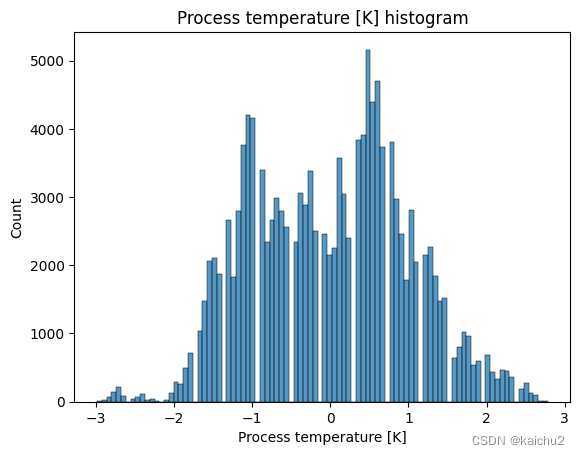
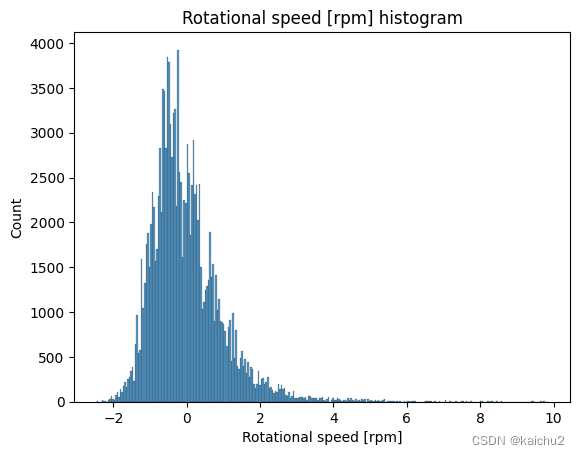
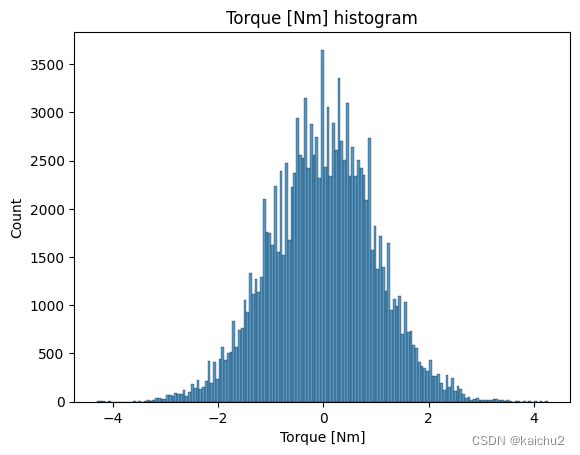
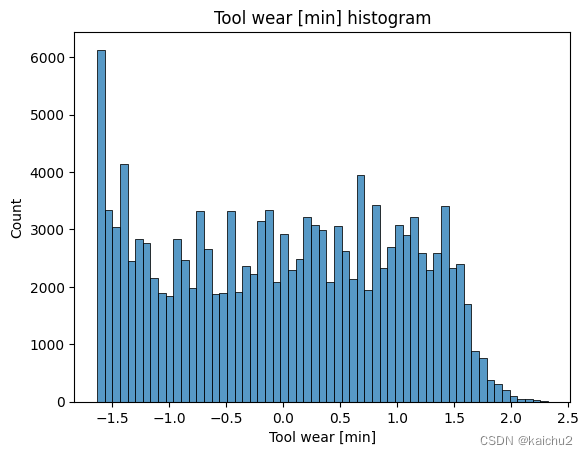
for col_name in num_features.columns:sns.histplot(num_features[col_name])plt.title(f'{col_name} histogram')plt.show()
# Compute the correlation matrix
correlation_matrix = train_encoded.corr()# Set up the figure and axes
plt.figure(figsize=(10, 8))# Create the heatmap using Seaborn
sns.heatmap(correlation_matrix, annot=True, cmap='coolwarm', fmt=".2f")# Set plot title
plt.title('Correlation Heatmap')
# 删除ProductID,对模型的表现无影响
df_train_encoded = train_encoded.drop('Product ID', axis=1)
df_test_encoded = test_encoded.drop('Product ID', axis=1)df_train_encoded = train_encoded.drop("id",axis=1)
df_test_encoded = test_encoded.drop("id",axis=1)
df_train_encoded

五、模型训练和预测
# 训练
import numpy as np # linear algebra
import pandas as pd # data processing, CSV file I/O (e.g. pd.read_csv)
import matplotlib.pyplot as plt # plot data
from sklearn.model_selection import train_test_split
from sklearn.metrics import roc_curve, roc_auc_score
from tensorflow import keras
from tensorflow.keras import layersmodel_type = "fc"
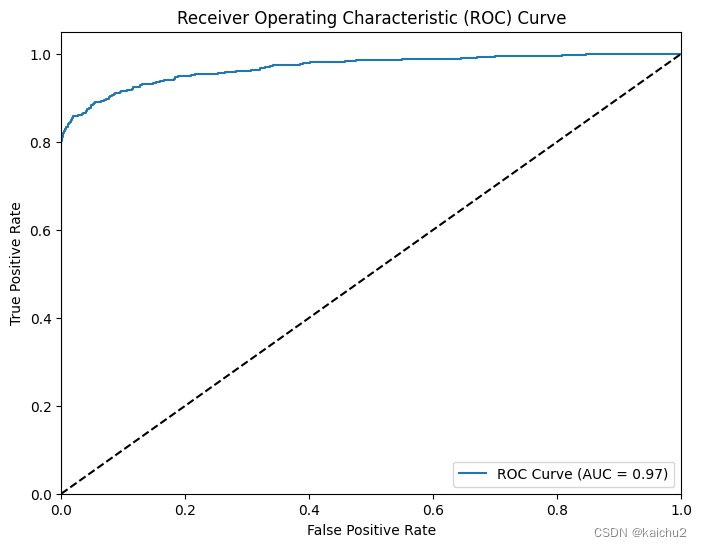
if model_type == "fc":# Split the encoded train data into X & yX_train = df_train_encoded.drop('Machine failure', axis=1)X_train = X_train.drop("id",axis=1)y_train = df_train_encoded['Machine failure']# Split the train data in train and valid setX_train, X_valid, y_train, y_valid = train_test_split(X_train,y_train,test_size=0.2)input_shape = (X_train.shape[1],)  # Creating a tuple with a single element# Building the deep learning modelmodel = keras.Sequential([layers.Dense(units=256, activation='relu', input_shape= input_shape),layers.Dense(units=128, activation='relu'),layers.Dense(units=64, activation='relu'),layers.Dense(units=1, activation='sigmoid')])# Compiling the modelmodel.compile(optimizer='adam',loss='binary_crossentropy',metrics=['binary_accuracy'])# This will run the model and plot the learning curveearly_stopping = keras.callbacks.EarlyStopping(patience=10,min_delta=0.001,restore_best_weights=True,)history = model.fit(X_train.astype(np.float32), y_train.astype(np.float32),validation_data=(X_valid.astype(np.float32), y_valid.astype(np.float32)),batch_size=512, # 512最佳epochs=200,callbacks=[early_stopping],)y_pred = model.predict(X_valid.astype(np.float32))# Calculate the ROC curvefpr, tpr, thresholds = roc_curve(y_valid, y_pred)# Calculate the ROC AUC scoreroc_auc = roc_auc_score(y_valid, y_pred)print("ROC AUC Score:", roc_auc)# Plot the ROC curveplt.figure(figsize=(8, 6))plt.plot(fpr, tpr, label=f'ROC Curve (AUC = {roc_auc:.2f})')plt.plot([0, 1], [0, 1], 'k--')plt.xlim([0.0, 1.0])plt.ylim([0.0, 1.05])plt.xlabel('False Positive Rate')plt.ylabel('True Positive Rate')plt.title('Receiver Operating Characteristic (ROC) Curve')plt.legend(loc='lower right')plt.show()
Epoch 1/200
214/214 [] - 1s 3ms/step - loss: 0.0739 - binary_accuracy: 0.9845 - val_loss: 0.0212 - val_binary_accuracy: 0.9966
Epoch 2/200
214/214 [] - 0s 2ms/step - loss: 0.0233 - binary_accuracy: 0.9960 - val_loss: 0.0207 - val_binary_accuracy: 0.9964
Epoch 3/200
214/214 [] - 0s 2ms/step - loss: 0.0226 - binary_accuracy: 0.9960 - val_loss: 0.0190 - val_binary_accuracy: 0.9968
Epoch 4/200
214/214 [] - 1s 3ms/step - loss: 0.0223 - binary_accuracy: 0.9959 - val_loss: 0.0182 - val_binary_accuracy: 0.9968
Epoch 5/200
214/214 [] - 0s 2ms/step - loss: 0.0222 - binary_accuracy: 0.9960 - val_loss: 0.0184 - val_binary_accuracy: 0.9968
Epoch 6/200
214/214 [] - 1s 2ms/step - loss: 0.0223 - binary_accuracy: 0.9960 - val_loss: 0.0190 - val_binary_accuracy: 0.9968
Epoch 7/200
214/214 [] - 0s 2ms/step - loss: 0.0219 - binary_accuracy: 0.9960 - val_loss: 0.0187 - val_binary_accuracy: 0.9968
Epoch 8/200
214/214 [] - 1s 2ms/step - loss: 0.0220 - binary_accuracy: 0.9960 - val_loss: 0.0185 - val_binary_accuracy: 0.9968
Epoch 9/200
214/214 [] - 1s 2ms/step - loss: 0.0218 - binary_accuracy: 0.9960 - val_loss: 0.0184 - val_binary_accuracy: 0.9968
Epoch 10/200
214/214 [] - 0s 2ms/step - loss: 0.0217 - binary_accuracy: 0.9960 - val_loss: 0.0183 - val_binary_accuracy: 0.9968
Epoch 11/200
214/214 [] - 0s 2ms/step - loss: 0.0216 - binary_accuracy: 0.9960 - val_loss: 0.0189 - val_binary_accuracy: 0.9968
Epoch 12/200
214/214 [] - 0s 2ms/step - loss: 0.0216 - binary_accuracy: 0.9960 - val_loss: 0.0186 - val_binary_accuracy: 0.9968
Epoch 13/200
214/214 [] - 1s 2ms/step - loss: 0.0215 - binary_accuracy: 0.9960 - val_loss: 0.0185 - val_binary_accuracy: 0.9968
853/853 [] - 1s 616us/step
ROC AUC Score: 0.9690019245164365
或者采用随机森林训练并预测
RandomForestClassifier是一种基于bagging框架的决策树模型,它由多个决策树组成,每个决策树都是基于不同的数据集进行训练的。在预测时,随机森林会将每个决策树的预测结果进行平均或投票,以得到最终的预测结果。RandomForestClassifier具有以下参数:
- n_estimators:决策树的数量。
- criterion:衡量分裂质量的标准。
- max_depth:决策树的最大深度。
- min_samples_split:拆分内部节点所需的最小样本数。
- min_samples_leaf:在叶节点处需要的最小样本数。
- min_weight_fraction_leaf:叶节点中包含的最少权重所占比例。
- max_features:寻找最佳拆分时要考虑的特征数量。
- max_leaf_nodes:最大叶子节点数。
- min_impurity_decrease:内部节点不满足阈值时所允许的不纯度减少量。
- min_impurity_split:内部节点不满足阈值时所允许的不纯度分割量。
随机森林有许多优点,例如:
- 准确率极高
- 能够有效地在大数据集上运行
- 引入了随机性,不容易过拟合
- 有很好的抗噪声能力,但是在数据噪音比较大的情况下会过拟合
- 能处理很高维度的数据,而且不用降维
- 不仅能处理离散型数据,还能处理连续型数据,而且不需要将数据集规范化
- 训练速度快,能够得到变量重要性排序
- 容易实现并行化
- 即使对于缺失值问题也能够获得很好得结果
- 超参数的数量不是很多,并且都能很直观地了解它们多代表的含义 。
随机森林的缺点包括:
1、训练时间长:随机森林需要大量的计算资源和时间来训练,因此它的训练时间通常比其他机器学习算法更长。
2、容易过拟合:随机森林在处理数据集时,可能会过度拟合数据,导致在新数据上的表现不佳 。
3、解释性差:随机森林的决策过程较为复杂,难以解释每个特征对最终结果的影响。
4、对于某些任务可能表现不佳:随机森林可以处理各种自然语言任务,但对于某些特定的任务,比如图像识别、语音识别等,其表现可能不如专门设计的系统。
# 训练
import numpy as np # linear algebra
import pandas as pd # data processing, CSV file I/O (e.g. pd.read_csv)
import matplotlib.pyplot as plt # plot data
from sklearn.model_selection import train_test_split
from sklearn.metrics import roc_curve, roc_auc_score
from sklearn.ensemble import RandomForestClassifier
df_train_encoded = train_encoded.drop("Product ID",axis=1)
model_type = "randomforest"
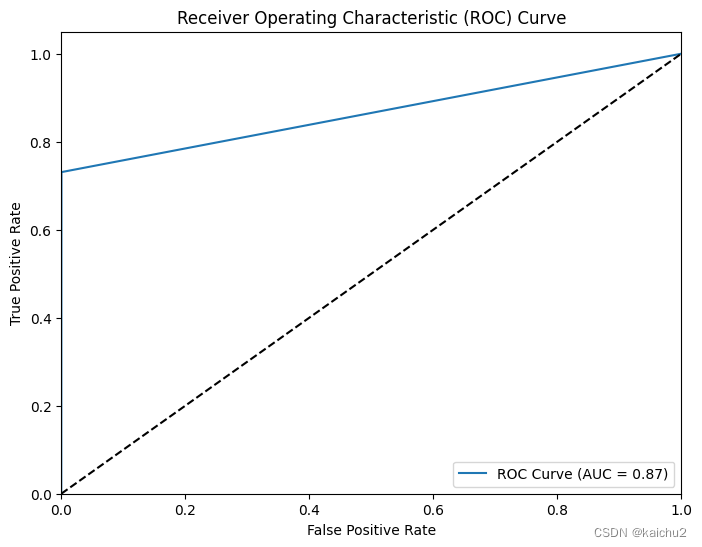
if model_type == "randomforest":# Split the encoded train data into X & yX_train = df_train_encoded.drop('Machine failure', axis=1)y_train = df_train_encoded['Machine failure']# Split the train data in train and valid setX_train, X_valid, y_train, y_valid = train_test_split(X_train,y_train,test_size=0.2)print(f"train_dataset:{X_train.shape}")# create a random forest classifierrandom_classifier = RandomForestClassifier(n_estimators=1000,min_samples_split=10,max_depth=957,random_state=42)# train the classifier on the training datarandom_classifier.fit(X_train, y_train)# 测试y_pred = random_classifier.predict(X_valid)# Calculate the ROC curvefpr, tpr, thresholds = roc_curve(y_valid, y_pred)# Calculate the ROC AUC scoreroc_auc = roc_auc_score(y_valid, y_pred)print("ROC AUC Score:", roc_auc)# Plot the ROC curveplt.figure(figsize=(8, 6))plt.plot(fpr, tpr, label=f'ROC Curve (AUC = {roc_auc:.2f})')plt.plot([0, 1], [0, 1], 'k--')plt.xlim([0.0, 1.0])plt.ylim([0.0, 1.05])plt.xlabel('False Positive Rate')plt.ylabel('True Positive Rate')plt.title('Receiver Operating Characteristic (ROC) Curve')plt.legend(loc='lower right')plt.show()
六、结果提交
# 提交结果
X_test = df_test_encoded.drop("Product ID",axis=1)
ids = df_test_encoded["Product ID"]
# y_pred = random_classifier.predict(X_test)
y_pred = model.predict(X_test.astype(np.float32))
# Flatten y_pred to make it 1-dimensional
y_pred = y_pred.flatten()
submission_df = pd.DataFrame({'ID': ids.index,  # Replace 'ids' with your list or array of IDs'Machine failure': y_pred  # Replace 'Machine failure' with the appropriate column name
})
# Save the DataFrame to a CSV file
submission_df.to_csv('submission.csv', index=False)

)


)


)
![[转]MySQL索引底层实现原理(此文个人觉得非常好收藏一下)](http://pic.xiahunao.cn/[转]MySQL索引底层实现原理(此文个人觉得非常好收藏一下))

:模式)
)
:频域和相位)


)