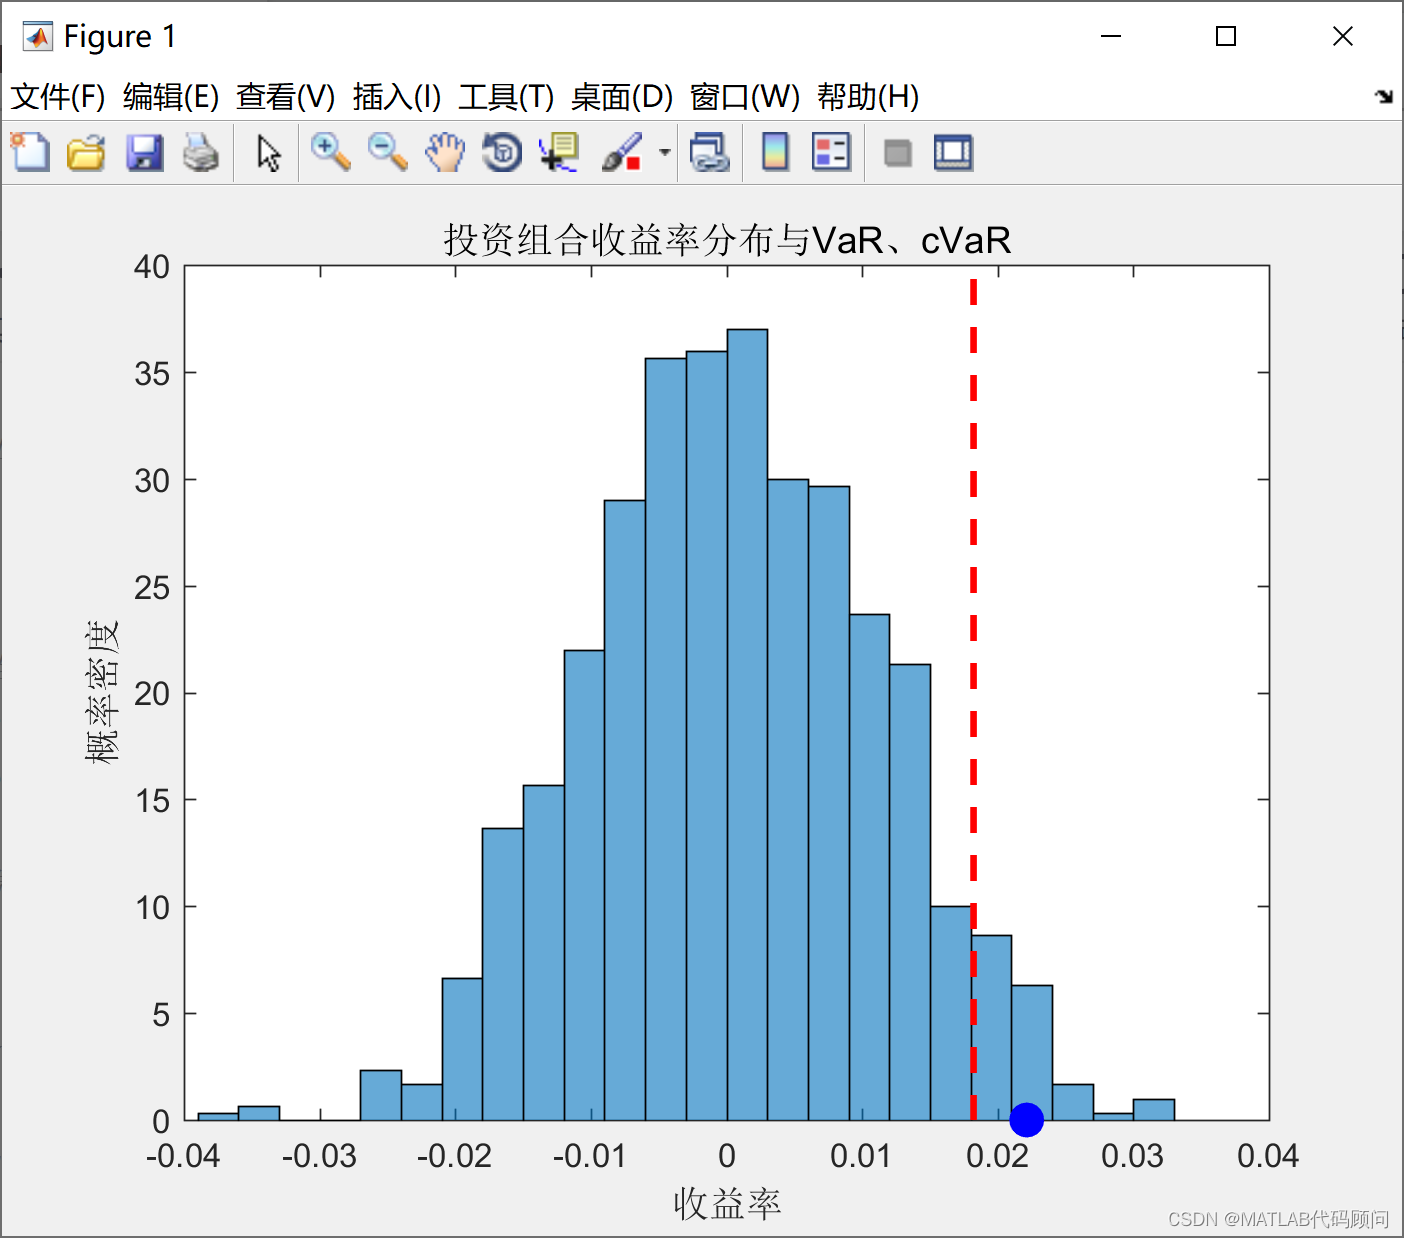
计算条件风险价值 (Conditional Value-at-Risk, cVaR) 是一种衡量投资组合风险的方法,它关注的是损失分布的尾部风险。
MATLAB代码如下:
clc;close all;clear all;warning off;%清除变量
rand('seed', 100);
randn('seed', 100);
format long g;% 随机产生数据(例如,投资组合的日收益率)
nSamples = 1000; % 设置样本数量
returns = normrnd(0, 0.01, [nSamples, 1]); % 正态分布的随机收益率% 定义置信水平
confidenceLevel = 0.95; % 95%的置信水平% 对收益率进行排序
[sortedReturns, sortIndices] = sort(returns);% 计算VaR(Value-at-Risk)
VaRIndex = round(confidenceLevel * nSamples);
VaR = sortedReturns(VaRIndex);% 计算cVaR
% cVaR是损失超过VaR的期望值
cVaRIndexStart = VaRIndex + 1;
cVaR = mean(sortedReturns(cVaRIndexStart:end));% 输出结果
fprintf('VaR at %d%% confidence level is: %.4f\n', round(confidenceLevel*100), VaR);
fprintf('cVaR at %d%% confidence level is: %.4f\n', round(confidenceLevel*100), cVaR);% 数据可视化
figure;
histogram(returns, 'Normalization', 'pdf', 'BinMethod', 'auto');
hold on;
% 绘制VaR和cVaR线
xlimits = xlim;
plot([VaR, VaR], ylim, 'r--', 'LineWidth', 2);
% text(VaR, ylim(2)*0.7, sprintf('VaR: %.4f', VaR), 'Color', 'r');% cVaR是一个期望值,所以我们用一个点来表示它在直方图上的位置
plot(cVaR, 0, 'bo', 'MarkerSize', 10, 'MarkerFaceColor', 'b');
% text(cVaR, ylim(2)*0.6, sprintf('cVaR: %.4f', cVaR), 'Color', 'b');% 设置图表标题和坐标轴标签
title('投资组合收益率分布与VaR、cVaR');
xlabel('收益率');
ylabel('概率密度');% 释放hold状态
hold off;
程序结果如下:


)


》)


)