上一节我们讲了用泛型实现返回结果,这一节我们来讲讲在函数签名里面使用泛型来对输入参数进行自适配。
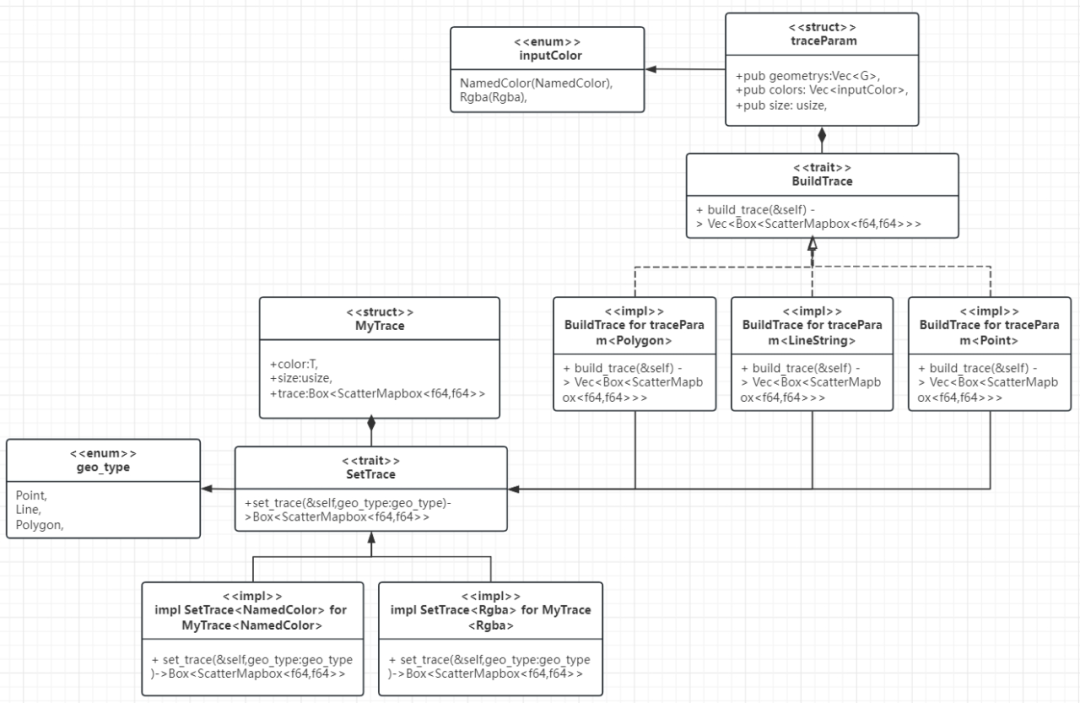
先看UML设计图:

好吧,看起来有点复杂,我们一个个来解释。
首先定义的是一个生成绘图元素需要的参数结构,并且定义个特性,就叫做构造绘图元素build_trace。
pub struct traceParam<G>{pub geometrys:Vec<G>,pub colors: Vec<inputColor>,pub size: usize,
}pub trait BuildTrace{fn build_trace(&self) -> Vec<Box<ScatterMapbox<f64,f64>>>;
}
绘图元素的参数,定义了三个参数:
-
第一个参数是输入一个几何要素集合,因为我们最起码有点线面三种几何要素,所以定义的是一个泛型变量
G。 -
第二参数是一个颜色集合,这里也可以用泛型,不过我们不需要那么多种颜色定义,这里给了一个枚举型的输入颜色,枚举定义如下:
#[derive(Debug,Clone)]
pub enum inputColor {NamedColor(NamedColor),Rgba(Rgba),
}
这里支持NameColor和Rgba两种颜色定义即可。
-
第三个参数是一个size,用来控制点的大小、线的宽度和面要素的边框,当然你也可以设定更多的参数,我这里仅用来说明,就不搞那么麻烦了:

接下去就可以写具体的实现了。
点要素的实现:
impl BuildTrace for traceParam<Point>{fn build_trace(&self) -> Vec<Box<ScatterMapbox<f64,f64>>> {let mut traces:Vec<Box<ScatterMapbox<f64,f64>>> = Vec::new();for (pnt,color) in zip(&self.geometrys,&self.colors) {let mut trace: Box<ScatterMapbox<f64, f64>> = ScatterMapbox::new(vec![pnt.y()], vec![pnt.x()]);trace = match color {inputColor::NamedColor(color) => {MyTrace{color:*color,size:self.size,trace:trace}.set_trace(geo_type::Point)},inputColor::Rgba(color) => {MyTrace{color:*color,size:self.size,trace:trace}.set_trace(geo_type::Point)},_ => panic!(""),};traces.push(trace);}traces}
}
线要素的实现:
impl BuildTrace for traceParam<LineString>{fn build_trace(&self) -> Vec<Box<ScatterMapbox<f64,f64>>> {let mut traces:Vec<Box<ScatterMapbox<f64,f64>>> = Vec::new();for (line,color) in zip(&self.geometrys,&self.colors) {let mut lat:Vec<f64>= Vec::new();let mut lon:Vec<f64>= Vec::new();for coord in line.coords(){lat.push(coord.y);lon.push(coord.x);}let mut trace: Box<ScatterMapbox<f64, f64>> = ScatterMapbox::new(lat, lon);trace = match color {inputColor::NamedColor(color) => {MyTrace{color:*color,size:self.size,trace:trace}.set_trace(geo_type::Line)},inputColor::Rgba(color) => {MyTrace{color:*color,size:self.size,trace:trace}.set_trace(geo_type::Line)},_ => panic!(""),};traces.push(trace);}traces}
}
面数据的实现:
impl BuildTrace for traceParam<Polygon>{fn build_trace(&self) -> Vec<Box<ScatterMapbox<f64,f64>>> {let mut traces:Vec<Box<ScatterMapbox<f64,f64>>> = Vec::new();for (poly,color) in zip(&self.geometrys,&self.colors) {let mut lat:Vec<f64>= Vec::new();let mut lon:Vec<f64>= Vec::new();for coord in poly.exterior(){lat.push(coord.y);lon.push(coord.x);}let mut trace: Box<ScatterMapbox<f64, f64>> = ScatterMapbox::new(lat, lon);trace = match color {inputColor::NamedColor(color) => {MyTrace{color:*color,size:self.size,trace:trace}.set_trace(geo_type::Polygon)},inputColor::Rgba(color) => {MyTrace{color:*color,size:self.size,trace:trace}.set_trace(geo_type::Polygon)},_ => panic!(""),};traces.push(trace);for ipoly in poly.interiors(){let mut ilat:Vec<f64>= Vec::new();let mut ilon:Vec<f64>= Vec::new();for coord in poly.exterior(){ilat.push(coord.y);ilon.push(coord.x);}trace = ScatterMapbox::new(ilat, ilon);      trace = MyTrace{color:NamedColor::White,size:self.size,trace:trace}.set_trace(geo_type::Polygon);traces.push(trace);}}traces}
}
里面三个方法都用了一个处理trace的方法,实现如下:
struct MyTrace<T>{color:T,size:usize,trace:Box<ScatterMapbox<f64,f64>>
}enum geo_type{Point,Line,Polygon,
}
trait SetTrace<T> {fn set_trace(&self,geo_type:geo_type)->Box<ScatterMapbox<f64,f64>>;
}impl SetTrace<NamedColor> for MyTrace<NamedColor>{fn set_trace(&self,geo_type:geo_type)->Box<ScatterMapbox<f64,f64>> {match geo_type{geo_type::Point =>{let t = *self.trace.to_owned().marker(Marker::new().color(self.color)).show_legend(false);Box::new(t)},geo_type::Line =>{let t = *self.trace.to_owned().line(Line::new().width(self.size as f64).color(self.color)).show_legend(false);Box::new(t)},geo_type::Polygon=> {let t = *self.trace.to_owned().fill(plotly::scatter_mapbox::Fill::ToSelf).fill_color(self.color).show_legend(false);Box::new(t)},_ => panic!("")}}
}impl SetTrace<Rgba> for MyTrace<Rgba>{fn set_trace(&self,geo_type:geo_type)->Box<ScatterMapbox<f64,f64>> {match geo_type{geo_type::Point =>{let t = *self.trace.to_owned().marker(Marker::new().color(self.color)).show_legend(false);Box::new(t)},geo_type::Line =>{let t = *self.trace.to_owned().line(Line::new().width(self.size as f64).color(self.color)).show_legend(false);Box::new(t)},geo_type::Polygon=> {let t = *self.trace.to_owned().fill(plotly::scatter_mapbox::Fill::ToSelf).fill_color(self.color).show_legend(false);Box::new(t)},_ => panic!("")}}
}
这两个方法,几乎99%是想同的,只是输入的颜色类型不一样,这样就是静态语言的麻烦之处了,只要函数签名不一致,就相当于两个方法,看到这里,大家可能想问,上一节讲过的泛型,在这里能用么?答案当然可以,不过就算用泛型,最终编译出来的代码也会因为编译器的处理,而实现函数单态化,即编译器会针对具体情况,编译出多个静态函数出来。所以这里如果继续抽象,也不是不行,但是算做过度设计了。
之后,就可以写一个绘制函数,然后进行调用了:
pub fn plot_draw_trace(traces:Vec<Box<ScatterMapbox<f64,f64>>>,outimg: Option<&str>){let mut plot = Plot::new();for t in traces{plot.add_trace(t);}let layout = _get_layout(1024, 800, Center::new(39.9, 116.3),MapboxStyle::Dark);plot.set_layout(layout);match outimg {Some(out) => plot.write_image(out, ImageFormat::PNG, 1200, 900, 1.0),None => plot.show(),}
}//这个是一个内部函数,用来初始化构造制图参数的。
fn  _get_layout(width:usize, height:usize,cnt:Center,ms:MapboxStyle) -> Layout{Layout::new().drag_mode(DragMode::Zoom).margin(Margin::new().top(10).left(10).bottom(10).right(10)).width(width).height(height).mapbox(Mapbox::new().style(ms).access_token("pk.eyJ1IjoiYWxsZW5sdTIwMDgiLCJhIjoiY2xxZjNsaGtmMDd0ZTJqcWM1MzRmemx1NCJ9.TbiPQB6j1w9ilBP4pFHRRw").center(cnt).zoom(10),)
}
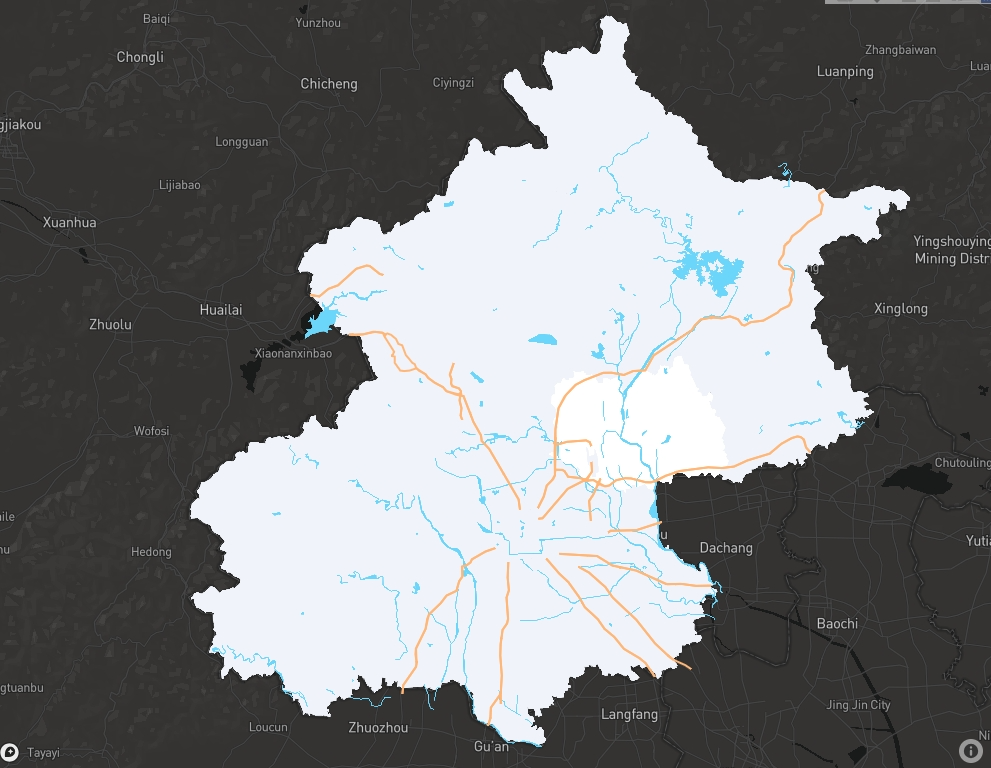
最后我们写一个测试调用方法,来绘制一下百度地图:
// 因为在Html里面绘制比较慢,所以我这里就仅画三个图层
#[test]
fn draw_bd_style(){let shp1 = "./data/shp/北京行政区划.shp";let poly1:Vec<Polygon> = readShapefile::shp::read_shp(shp1);let colors:Vec<inputColor> = (0..poly1.len()).map(|x|inputColor::Rgba(Rgba::new(240,243,250,1.0))).collect();let mut t1 = traceParam{geometrys:poly1,colors:colors,size:0}.build_trace();let shp2 = "./data/shp/面状水系.shp";let poly2:Vec<Polygon> = readShapefile::shp::read_shp(&shp2);let colors:Vec<inputColor> = (0..poly2.len()).map(|x|inputColor::Rgba(Rgba::new(108,213,250,1.0))).collect();let mut t2 = traceParam{geometrys:poly2,colors:colors,size:0}.build_trace();let shp3 = "./data/shp/高速.shp";let line1:Vec<LineString> = readShapefile::shp::read_shp(&shp3);let colors:Vec<inputColor> = (0..line1.len()).map(|x|inputColor::Rgba(Rgba::new(255,182,118,1.0))).collect();let mut t3 = traceParam{geometrys:line1,colors:colors,size:1}.build_trace();t1.append(&mut t2);t1.append(&mut t3);plot_draw_trace(t1,None);
}
绘制效果如下:

注意:plotly.rs的JS引用的是Mapbox,所以网络访问上可能会有一些障碍,有可能需要科学上网……
打完收工。


