环境和包:
环境
python:python-3.12.0-amd64包:
matplotlib 3.8.2
pandas 2.1.4
openpyxl 3.1.2
scipy 1.12.0
代码:
import pandas as pd
import matplotlib.pyplot as plt
from mpl_toolkits.mplot3d import Axes3D
from scipy.interpolate import griddata
from matplotlib.colors import ListedColormap
import numpy as np
from matplotlib import pyplot as plt
from matplotlib import font_manager#解决中文乱码问题
plt.rcParams['font.sans-serif']=['kaiti']
plt.rcParams["axes.unicode_minus"]=False #解决图像中的"-"负号的乱码问题# 创建自定义颜色调色板
def create_custom_colormap(name, colors):colors = np.array(colors)cmap = plt.get_cmap(name)cmap.set_over(colors[-1])cmap.set_under(colors[0])cmap.set_bad(colors[0])return cmap# 定义一些颜色
#colors = ['red', 'blue', 'green', 'yellow', 'purple']
colors = ['red', 'orange', 'yellow', 'green', 'blue']
# 创建自定义颜色映射对象
my_colormap = create_custom_colormap('turbo_r', colors)
# 读取Excel文件
df = pd.read_excel('煤仓模拟参数41.xlsx')
#df = pd.read_excel('煤仓模拟参数222.xlsx')
#print('数量:',df)
# 提取x、y、z数据
x = df['X轴'].values
y = df['Y轴'].values
z = df['Z轴'].values# 创建三维坐标轴对象
fig = plt.figure()
ax = fig.add_subplot(111, projection='3d')# 使用平滑曲面插值方法创建地形图(假设使用样条插值方法)
#smoothed_terrain = ax.scatter(x, y, z, cmap='viridis')# 使用griddata函数进行插值,这里使用最近邻插值法,你也可以选择其他的插值方法
# 插值后的数据用于绘制平滑曲面地形图
grid_x, grid_y = np.mgrid[min(x):max(x):100j, min(y):max(y):100j]
grid_z = griddata((x, y), z, (grid_x, grid_y), method='cubic')
# 使用平滑曲面插值后的数据绘制地形图
# 绘制地形图(camp:coolwarm,viridis,plasma,inferno,magma,cividis,rainbow)
cmap = ListedColormap(['blue', 'green', 'yellow', 'orange','Red'])
ax.contourf(grid_x, grid_y, grid_z, levels=300, cmap=my_colormap)
#ax.contourf(grid_x, grid_y, grid_z, levels=60, cmap='viridis')
ax.grid(True)# 设置x轴的刻度间隔
ax.set_xticks(np.arange(-7500, 7500, 2500))  # 从-7500到7500,步长为2500# 设置y轴的刻度间隔
ax.set_yticks(np.arange(-7500, 7500, 2500))  # 从-7500到7500,步长为2500# 设置z轴的刻度间隔
ax.set_zticks(np.arange(10000, 31000, 2500))   # 从10000到31000,步长为2500#计算面积,容积,最高料位等
# 查找同一列'Column A'中相同的值对应的'Column B'中的最小值并求平均值
#h = df.groupby('Y轴')['Z轴'].min().mean()-16452
h = df['Z轴'].mean()-16452#print(h)# 计算圆柱体的体积
#pi = np.pi
#V = np.pi * r**2 * h  # 圆柱体体积公式:πr²h  r 9000  h-16452  983.6  3000上下就是对的
#print(V)# 计算圆柱体的体积
r=9000
pi = np.pi
V = np.pi * r**2 * h  # 圆柱体体积公式:πr²h  r 9000  h-16452  983.6  3000上下就是对的
#print('V=',V)def mm3_to_m3(mm3):m3 = mm3 / (1000**3)return m3# 测试代码
mm3_value = V  # 1立方米等于1000000立方毫米
m3_value = mm3_to_m3(mm3_value)
print(m3_value)m3_value_1=m3_value+983.6
print('体积=',m3_value_1)zl=1.5*m3_value_1
print('质量=',zl)VP=m3_value_1/6022.72#6022.72为总桶的总体积
print('容积=',VP)# 找到该列的最大值和最小值
max_value = df['Z轴'].max()
min_value = df['Z轴'].min()
h=h+16342
# 打印结果
print("最高料位=",max_value)
print("最低料位=",min_value)
print("平均料位=",h)
# 添加标题和坐标轴标签
ax.set_title('三维平滑曲面地形图--去除无效点(原始颜色)')
ax.set_xlabel('X')
ax.set_ylabel('Y')
ax.set_zlabel('Z')
# 在图形上添加文本
str = "体积="+np.array2string(m3_value_1)+"\n质量="+np.array2string(zl)+"\n容积=容积="+"{:.2%}".format(VP)+"\n最高料位="+np.array2string(max_value)+"\n最低料位="+np.array2string(min_value)+"\n平均料位="+np.array2string(h)
ax.text(-5000,-5000,10000,str)
ax.set_axis_off()  # 关闭坐标轴
plt.show()
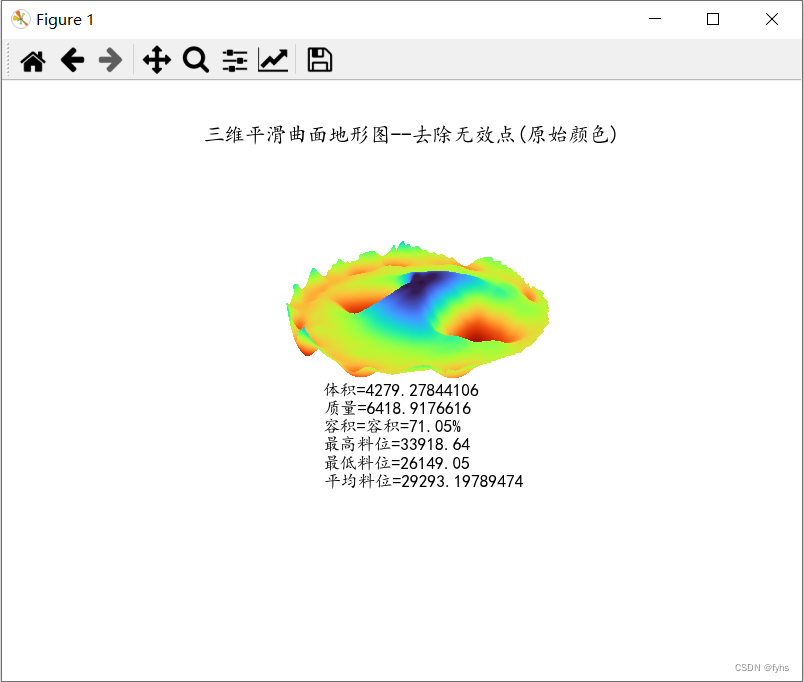
效果图:

资源下载(分享-->资源分享):
链接:https://pan.baidu.com/s/1UlP0lsma8OWchfV5kstEFQ
提取码:kdgr

)
![[Java安全入门]三.CC1链](http://pic.xiahunao.cn/[Java安全入门]三.CC1链)


)
:客户端接口(三)之 信息模式)


