一.递归神经网络基础概念
递归神经网络(Recursive Neural Network, RNN)可以解决有时间序列的问题,处理诸如树、图这样的递归结构。
CNN主要应用在计算机视觉CV中,RNN主要应用在自然语言处理NLP中。
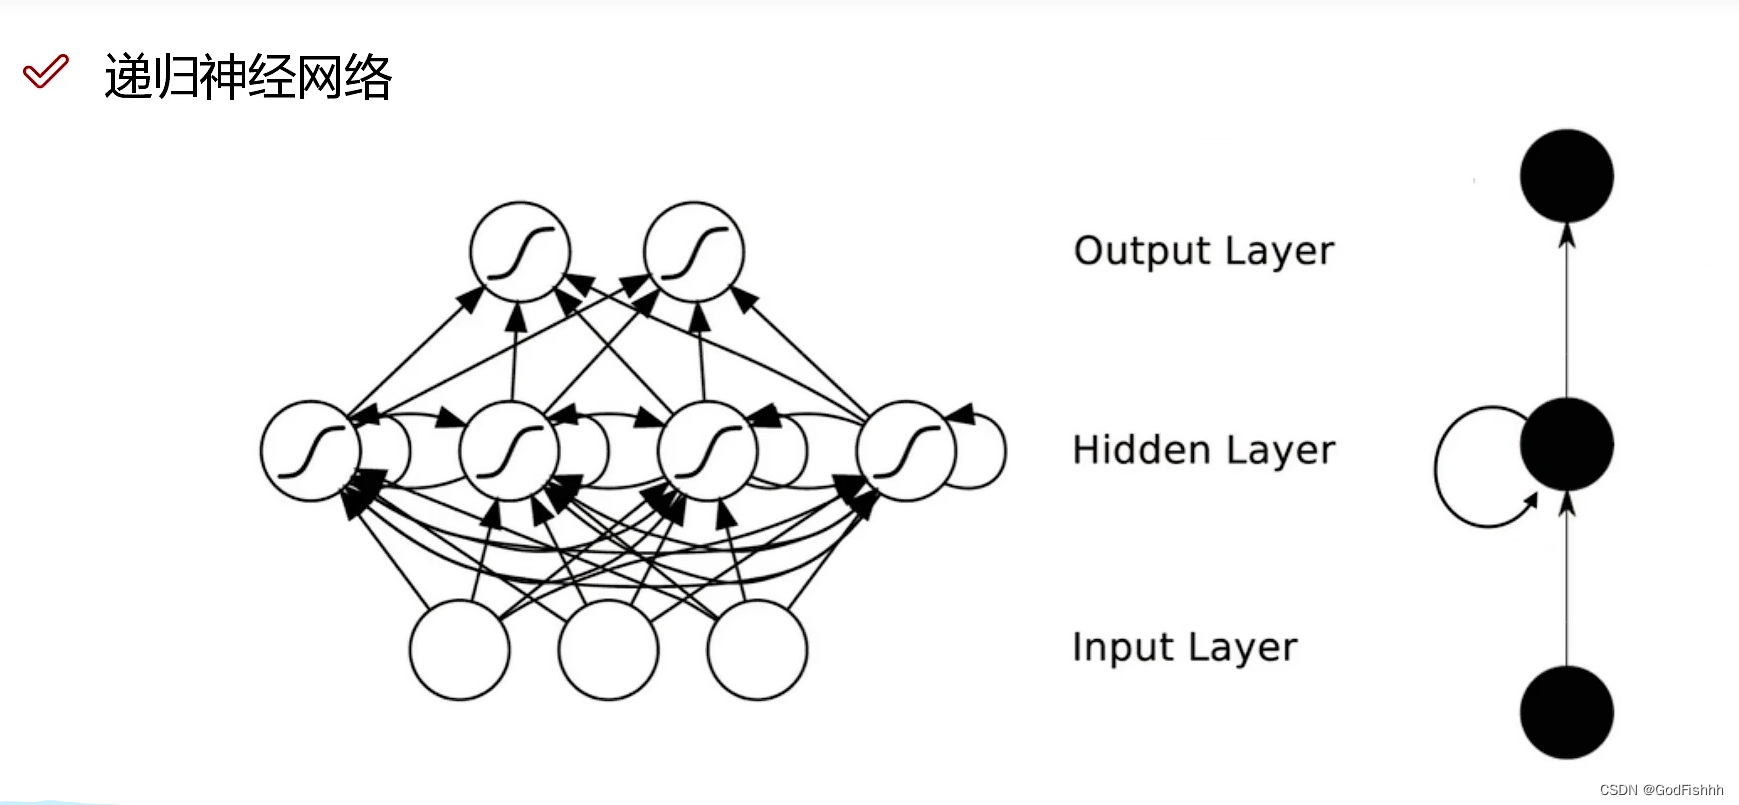
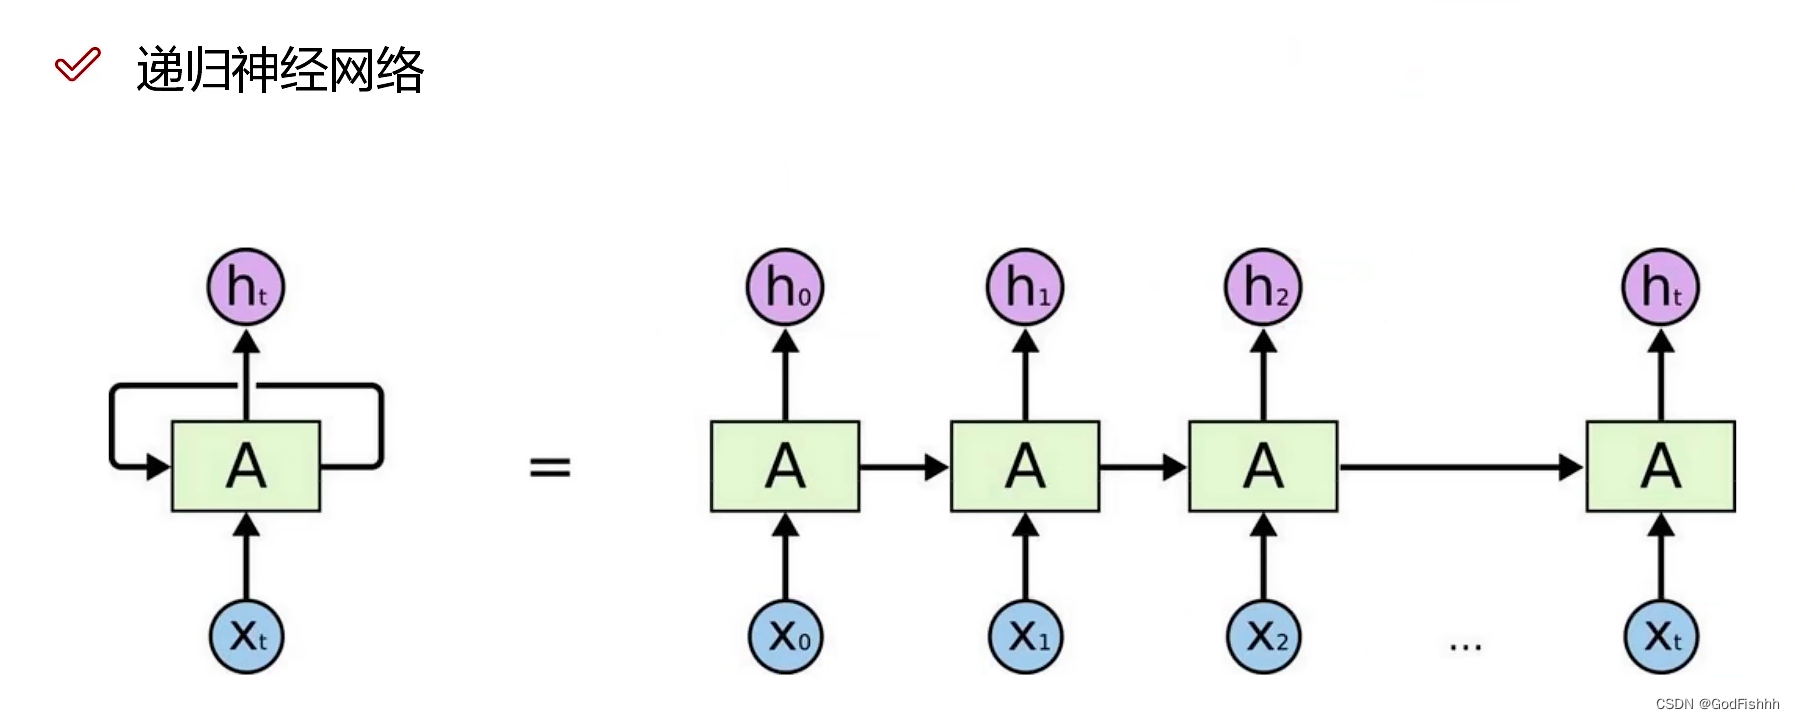
1.h0,h1.....ht对应的是不同输入得到的中间结果。
2.处理自然语言I am GodFishhh or AFish:
则对应的输入为X0 -- I,X1 -- am,X2 -- GodFishhh,X3 -- or,X4 -- AFish,再通过一定的方法将自然语言输入转换为计算机能够理解的形式(例如Word2Vec方法,将文本中的词语转换为向量形式)。
3.RNN网络最后输出的结果会考虑之前所有的中间结果,记录的数据太多可能会产生误差或者错误。
LSTM长短记忆网络是一种特殊的递归神经网络,可以解决上述记录数据太多的问题:
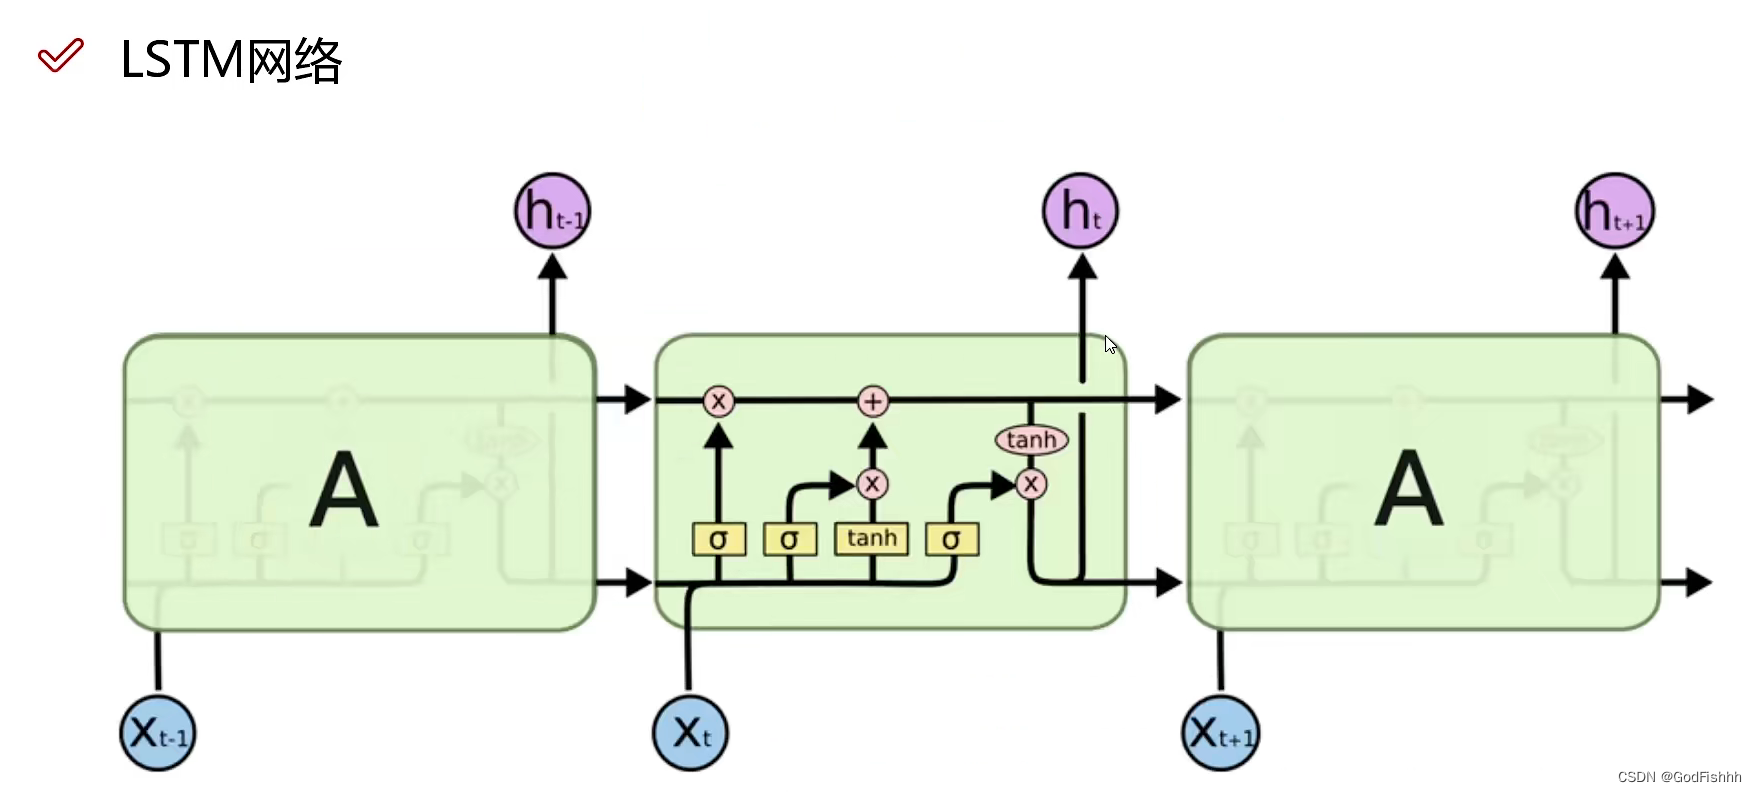
在普通的RNN中,t-1时刻得到的输出值h(t-1)会被简单的复制到t时刻,并与t时刻的输入值X(t)整合再经过一个tanh函数后形成输出。
而在LSTM中,对于t-1时刻得到的输出值h(t-1)会有更加复杂的操作。
二.项目介绍
通过LSTM长短记忆网络实现预测股票的趋势
三.项目流程详解
3.1.项目架构
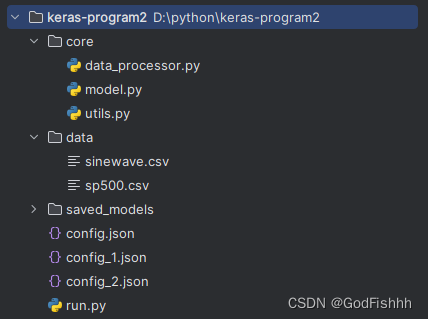
3.2.导入所需要的工具包
import os
import json
import time
import math
import matplotlib.pyplot as plt
import numpy as np
from core.data_processor import DataLoader
from core.model import Model
from keras.utils import plot_model
plot_model库的使用:
通过plot_model库可以使模型可视化
使用plot_model库需要安装pydot和graphviz库:
from keras.utils import plot_model通过下述代码检测是否安装了pydot和grapviz库
import pydot
print(pydot.find_graphviz()) 
相关库的安装可以参考博主写的安装教程:
深度学习(9)-pydot库和graphviz库安装流程详解-CSDN博客
3.3.读取所需参数和数据
# 读取所需参数configs = json.load(open('config.json', 'r'))if not os.path.exists(configs['model']['save_dir']):os.makedirs(configs['model']['save_dir'])# 读取数据data = DataLoader(os.path.join('data', configs['data']['filename']),configs['data']['train_test_split'],configs['data']['columns'])利用json文件来保存所需要的参数


data_processor文件中定义了DataLoader类:
import math
import numpy as np
import pandas as pdclass DataLoader():"""A class for loading and transforming data for the lstm model"""def __init__(self, filename, split, cols):dataframe = pd.read_csv(filename)i_split = int(len(dataframe) * split)self.data_train = dataframe.get(cols).values[:i_split]self.data_test  = dataframe.get(cols).values[i_split:]self.len_train  = len(self.data_train)self.len_test   = len(self.data_test)self.len_train_windows = Nonedef get_test_data(self, seq_len, normalise):'''Create x, y test data windowsWarning: batch method, not generative, make sure you have enough memory toload data, otherwise reduce size of the training split.'''data_windows = []for i in range(self.len_test - seq_len):data_windows.append(self.data_test[i:i+seq_len])data_windows = np.array(data_windows).astype(float)data_windows = self.normalise_windows(data_windows, single_window=False) if normalise else data_windowsx = data_windows[:, :-1]y = data_windows[:, -1, [0]]return x,ydef get_train_data(self, seq_len, normalise):'''Create x, y train data windowsWarning: batch method, not generative, make sure you have enough memory toload data, otherwise use generate_training_window() method.'''data_x = []data_y = []for i in range(self.len_train - seq_len):x, y = self._next_window(i, seq_len, normalise)data_x.append(x)data_y.append(y)return np.array(data_x), np.array(data_y)def generate_train_batch(self, seq_len, batch_size, normalise):'''Yield a generator of training data from filename on given list of cols split for train/test'''i = 0while i < (self.len_train - seq_len):x_batch = []y_batch = []for b in range(batch_size):if i >= (self.len_train - seq_len):# stop-condition for a smaller final batch if data doesn't divide evenlyyield np.array(x_batch), np.array(y_batch)i = 0x, y = self._next_window(i, seq_len, normalise)x_batch.append(x)y_batch.append(y)i += 1yield np.array(x_batch), np.array(y_batch)def _next_window(self, i, seq_len, normalise):'''Generates the next data window from the given index location i'''window = self.data_train[i:i+seq_len]window = self.normalise_windows(window, single_window=True)[0] if normalise else windowx = window[:-1]y = window[-1, [0]]return x, ydef normalise_windows(self, window_data, single_window=False):'''Normalise window with a base value of zero'''normalised_data = []window_data = [window_data] if single_window else window_datafor window in window_data:normalised_window = []for col_i in range(window.shape[1]):normalised_col = [((float(p) / float(window[0, col_i])) - 1) for p in window[:, col_i]]normalised_window.append(normalised_col)normalised_window = np.array(normalised_window).T # reshape and transpose array back into original multidimensional formatnormalised_data.append(normalised_window)return np.array(normalised_data)
3.4.创建RNN模型
# 创建RNN模型model = Model()mymodel = model.build_model(configs)# 生成模型的结构,并保存在model.png中plot_model(mymodel, to_file='model.png', show_shapes=True)model文件中定义了Model类:
import os
import math
import numpy as np
import datetime as dt
from numpy import newaxis
from core.utils import Timer
from keras.layers import Dense, Activation, Dropout, LSTM
from keras.models import Sequential, load_model
from keras.callbacks import EarlyStopping, ModelCheckpointclass Model():"""LSTM 模型"""def __init__(self):self.model = Sequential()def load_model(self, filepath):print('[Model] Loading model from file %s' % filepath)self.model = load_model(filepath)def build_model(self, configs):timer = Timer()timer.start()for layer in configs['model']['layers']:neurons = layer['neurons'] if 'neurons' in layer else Nonedropout_rate = layer['rate'] if 'rate' in layer else Noneactivation = layer['activation'] if 'activation' in layer else Nonereturn_seq = layer['return_seq'] if 'return_seq' in layer else Noneinput_timesteps = layer['input_timesteps'] if 'input_timesteps' in layer else Noneinput_dim = layer['input_dim'] if 'input_dim' in layer else Noneif layer['type'] == 'dense':self.model.add(Dense(neurons, activation=activation))if layer['type'] == 'lstm':self.model.add(LSTM(neurons, input_shape=(input_timesteps, input_dim), return_sequences=return_seq))if layer['type'] == 'dropout':self.model.add(Dropout(dropout_rate))self.model.compile(loss=configs['model']['loss'], optimizer=configs['model']['optimizer'])print('[Model] Model Compiled')timer.stop()return self.modeldef train(self, x, y, epochs, batch_size, save_dir):timer = Timer()timer.start()print('[Model] Training Started')print('[Model] %s epochs, %s batch size' % (epochs, batch_size))save_fname = os.path.join(save_dir, '%s-e%s.h5' % (dt.datetime.now().strftime('%d%m%Y-%H%M%S'), str(epochs)))callbacks = [EarlyStopping(monitor='val_loss', patience=2),ModelCheckpoint(filepath=save_fname, monitor='val_loss', save_best_only=True)]self.model.fit(x,y,epochs=epochs,batch_size=batch_size,callbacks=callbacks)self.model.save(save_fname)print('[Model] Training Completed. Model saved as %s' % save_fname)timer.stop()def train_generator(self, data_gen, epochs, batch_size, steps_per_epoch, save_dir):timer = Timer()timer.start()print('[Model] Training Started')print('[Model] %s epochs, %s batch size, %s batches per epoch' % (epochs, batch_size, steps_per_epoch))save_fname = os.path.join(save_dir, '%s-e%s.h5' % (dt.datetime.now().strftime('%d%m%Y-%H%M%S'), str(epochs)))callbacks = [ModelCheckpoint(filepath=save_fname, monitor='loss', save_best_only=True)]self.model.fit_generator(data_gen,steps_per_epoch=steps_per_epoch,epochs=epochs,callbacks=callbacks,workers=1)print('[Model] Training Completed. Model saved as %s' % save_fname)timer.stop()def predict_point_by_point(self, data):print('[Model] Predicting Point-by-Point...')predicted = self.model.predict(data)predicted = np.reshape(predicted, (predicted.size,))return predicteddef predict_sequences_multiple(self, data, window_size, prediction_len,debug=False):if debug == False:print('[Model] Predicting Sequences Multiple...')prediction_seqs = []for i in range(int(len(data)/prediction_len)):curr_frame = data[i*prediction_len]predicted = []for j in range(prediction_len):predicted.append(self.model.predict(curr_frame[newaxis,:,:])[0,0])curr_frame = curr_frame[1:]curr_frame = np.insert(curr_frame, [window_size-2], predicted[-1], axis=0)prediction_seqs.append(predicted)return prediction_seqselse :print('[Model] Predicting Sequences Multiple...')prediction_seqs = []for i in range(int(len(data)/prediction_len)):print (data.shape)curr_frame = data[i*prediction_len]print (curr_frame)predicted = []for j in range(prediction_len):predict_result = self.model.predict(curr_frame[newaxis,:,:])print (predict_result)final_result = predict_result[0,0]predicted.append(final_result)curr_frame = curr_frame[1:]print (curr_frame)curr_frame = np.insert(curr_frame, [window_size-2], predicted[-1], axis=0)print (curr_frame)prediction_seqs.append(predicted)def predict_sequence_full(self, data, window_size):print('[Model] Predicting Sequences Full...')curr_frame = data[0]predicted = []for i in range(len(data)):predicted.append(self.model.predict(curr_frame[newaxis,:,:])[0,0])curr_frame = curr_frame[1:]curr_frame = np.insert(curr_frame, [window_size-2], predicted[-1], axis=0)return predicted
utils文件中定义了Timer()类:
import datetime as dtclass Timer():def __init__(self):self.start_dt = Nonedef start(self):self.start_dt = dt.datetime.now()def stop(self):end_dt = dt.datetime.now()print('Time taken: %s' % (end_dt - self.start_dt))3.5.加载训练数据并训练模型
#加载训练数据x, y = data.get_train_data(seq_len=configs['data']['sequence_length'],normalise=configs['data']['normalise'])print (x.shape)print (y.shape)#训练模型model.train(x,y,epochs = configs['training']['epochs'],batch_size = configs['training']['batch_size'],save_dir = configs['model']['save_dir'])3.6.展示测试结果
#测试结果x_test, y_test = data.get_test_data(seq_len=configs['data']['sequence_length'],normalise=configs['data']['normalise'])#展示测试效果predictions = model.predict_sequences_multiple(x_test, configs['data']['sequence_length'], configs['data']['sequence_length'],debug=False)print (np.array(predictions).shape)plot_results_multiple(predictions, y_test, configs['data']['sequence_length'])四.完整代码
import os
import json
import time
import math
import matplotlib.pyplot as plt
import numpy as np
from core.data_processor import DataLoader
from core.model import Model
from keras.utils import plot_model# 绘图展示结果
def plot_results(predicted_data, true_data):fig = plt.figure(facecolor='white')ax = fig.add_subplot(111)ax.plot(true_data, label='True Data')plt.plot(predicted_data, label='Prediction')plt.legend()#plt.show()plt.savefig('results_1.png')def plot_results_multiple(predicted_data, true_data, prediction_len):fig = plt.figure(facecolor='white')ax = fig.add_subplot(111)ax.plot(true_data, label='True Data')plt.legend()for i, data in enumerate(predicted_data):padding = [None for p in range(i * prediction_len)]plt.plot(padding + data, label='Prediction')#plt.show()plt.savefig('results_multiple_1.png')#RNN时间序列
def main():#读取所需参数configs = json.load(open('config_2.json', 'r'))if not os.path.exists(configs['model']['save_dir']): os.makedirs(configs['model']['save_dir'])#读取数据data = DataLoader(os.path.join('data', configs['data']['filename']),configs['data']['train_test_split'],configs['data']['columns'])#创建RNN模型model = Model()mymodel = model.build_model(configs)plot_model(mymodel, to_file='model.png',show_shapes=True)#加载训练数据x, y = data.get_train_data(seq_len=configs['data']['sequence_length'],normalise=configs['data']['normalise'])print (x.shape)print (y.shape)#训练模型model.train(x,y,epochs = configs['training']['epochs'],batch_size = configs['training']['batch_size'],save_dir = configs['model']['save_dir'])#测试结果x_test, y_test = data.get_test_data(seq_len=configs['data']['sequence_length'],normalise=configs['data']['normalise'])#展示测试效果predictions_multiseq = model.predict_sequences_multiple(x_test, configs['data']['sequence_length'], configs['data']['sequence_length'])predictions_pointbypoint = model.predict_point_by_point(x_test,debug=True)        plot_results_multiple(predictions_multiseq, y_test, configs['data']['sequence_length'])plot_results(predictions_pointbypoint, y_test)if __name__ == '__main__':main()
五.数据预测结果
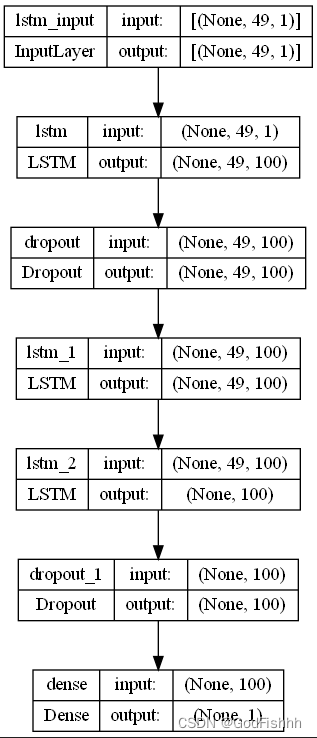
5.1.config_1参数的预测结果
网络模型:
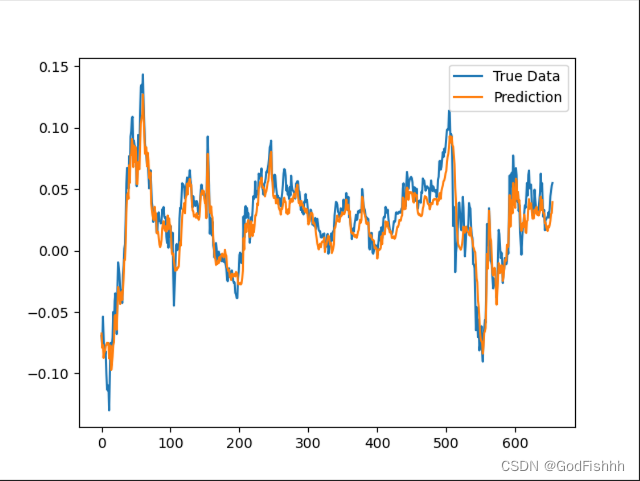
根据0-50时间长度数据预测1-51时间长度数据的预测图(一个一个点预测):
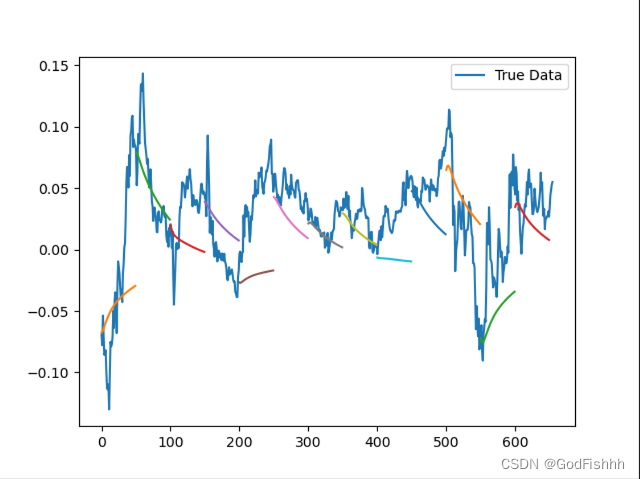
根据0-50时间长度数据预测51-100时间长度数据的预测图(一个一个序列预测):
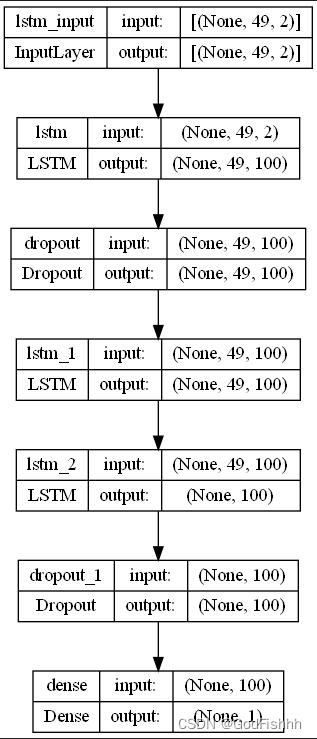
5.2.config_2参数的预测结果
网络模型:
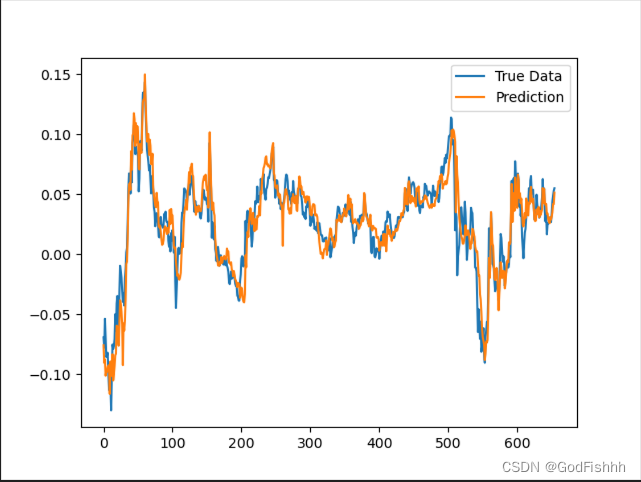
根据0-50时间长度数据预测1-51时间长度数据的预测图(一个一个点预测):
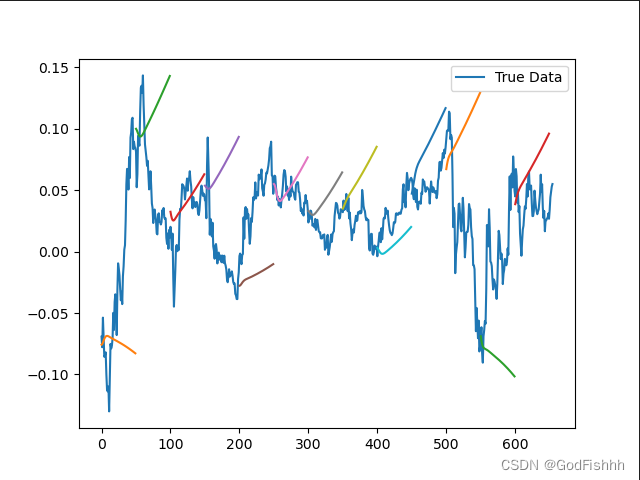
根据0-50时间长度数据预测51-100时间长度数据的预测图(一个一个序列预测):


)


-Hive)


)

