🧡💛💚TensorFlow2实战-系列教程 总目录
有任何问题欢迎在下面留言
本篇文章的代码运行界面均在Jupyter Notebook中进行
本篇文章配套的代码资源已经上传
1、环境测试
import tensorflow as tf
import numpy as np
tf.__version__
打印结果
‘2.10.0’
x1 =[[1,9],[3,6]]
x2 = tf.constant(x1)
print(x1)
print(x2)
打印结果:
[[1, 9], [3, 6]]
tf.Tensor( [[1 9] [3 6]], shape=(2, 2), dtype=int32)
2、导包读数据
import numpy as np
import pandas as pd
import matplotlib.pyplot as plt
import tensorflow as tf
from tensorflow.keras import layers
import tensorflow.keras
import warnings
warnings.filterwarnings("ignore")
%matplotlib inlinefeatures = pd.read_csv('temps.csv')
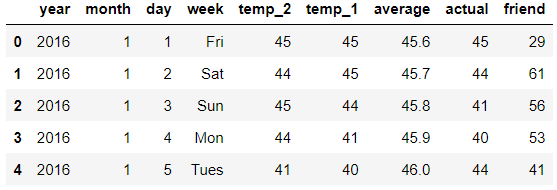
features.head()
打印结果:

- year,moth,day,week分别表示的具体的时间
- temp_2:前天的最高温度值
- temp_1:昨天的最高温度值
- average:在历史中,每年这一天的平均最高温度值
- actual:这就是我们的标签值了,当天的真实最高温度
- friend:这一列可能是凑热闹的,你的朋友猜测的可能值,咱们不管它就好了
星期是个文本特性,用onehot转换一下:
features = pd.get_dummies(features)
features.head(5)

3、标签制作与数据预处理
# 标签
labels = np.array(features['actual'])# 在特征中去掉标签
features= features.drop('actual', axis = 1)# 名字单独保存一下,以备后患
feature_list = list(features.columns)# 转换成合适的格式
features = np.array(features)
打印结果:
(348, 14)
from sklearn import preprocessing
input_features = preprocessing.StandardScaler().fit_transform(features)
input_features[0]
打印结果:
array([ 0. , -1.5678393 , -1.65682171, -1.48452388, -1.49443549, -1.3470703 , -1.98891668, 2.44131112, -0.40482045, -0.40961596, -0.40482045, -0.40482045, -0.41913682, -0.40482045])
4、 基于Keras构建网络模型
常用参数:
- activation:激活函数的选择,一般常用relu
- kernel_initializer,bias_initializer:权重与偏置参数的初始化方法
- kernel_regularizer,bias_regularizer:要不要加入正则化
- inputs:输入,可以自己指定,也可以让网络自动选 units:神经元个数
按顺序构造网络模型:
model = tf.keras.Sequential()
model.add(layers.Dense(16))
model.add(layers.Dense(32))
model.add(layers.Dense(1))
- 创建一个执行序列
- 添加全连接层,16个神经元
- 添加全连接层,32个神经元
- 添加全连接层,1个神经元,作为最后的输出
定好优化器和损失函数,然后训练:
model.compile(optimizer=tf.keras.optimizers.SGD(0.001), loss='mean_squared_error')
model.fit(input_features, labels, validation_split=0.25, epochs=10, batch_size=64)
- 指定SGD为优化器学习率为0.001,MSE为损失函数
- 指定数据和标签然后训练,25%为验证集,10个epochs
打印结果:
Epoch 1/10 5/5 - 0s 33ms/step - loss: 4267.9907 val_loss: 3133.0610
Epoch 2/10 5/5 0s 4ms/step - loss: 1925.8059 - val_loss: 3318.1531
Epoch 3/10 5/5 - 0s 3ms/step - loss: 181.2731 val_loss: 2728.9922
Epoch 4/10 5/5 0s 3ms/step - loss: 104.3410 - val_loss: 2093.8855
Epoch 5/10 5/5 - 0s 3ms/step - loss: 77.6116 - val_loss: 1377.6144
Epoch 6/10 5/5 0s 3ms/step - loss: 73.3877 - val_loss: 1163.6123
Epoch 7/10 5/5 0s 3ms/step - loss: 60.4262 val_loss: 867.4617
Epoch 8/10 5/5 0s 3ms/step - loss: 73.3110 - val_loss: 654.7820
Epoch 9/10 5/5 0s 3ms/step - loss: 36.6109 val_loss: 581.9786
Epoch 10/10 5/5 0s 3ms/step - loss: 56.6764 - val_loss: 383.0244
<keras.callbacks.History at 0x22634a22760>
从打印结果来看,训练集的损失和验证集的损失差距比较大,可能出现过拟合的现象
输入数据:
input_features.shape
打印结果:
(348, 14)
查看网络结构:
model.summary()
打印结果:
Model: “sequential”
Layer (type) Output Shape Param #
dense (Dense) multiple 240
dense_1 (Dense) multiple 544
dense_2 (Dense) multiple 33
Total params: 817
Trainable params: 817
Non-trainable params: 0
5、改初始化方法
model = tf.keras.Sequential()
model.add(layers.Dense(16,kernel_initializer='random_normal'))
model.add(layers.Dense(32,kernel_initializer='random_normal'))
model.add(layers.Dense(1,kernel_initializer='random_normal'))
model.compile(optimizer=tf.keras.optimizers.SGD(0.001), loss='mean_squared_error')
model.fit(input_features, labels, validation_split=0.25, epochs=100, batch_size=64)
部分打印结果:
Epoch 99/100 261/261 0s 42us/sample - loss: 27.9759 - val_loss: 41.2864
Epoch 100/100 261/261 0s 42us/sample - loss: 44.5327 - val_loss: 48.2574
很显然差距消失了
6、加入正则化惩罚项
model = tf.keras.Sequential()
model.add(layers.Dense(16,kernel_initializer='random_normal',kernel_regularizer=tf.keras.regularizers.l2(0.03)))
model.add(layers.Dense(32,kernel_initializer='random_normal',kernel_regularizer=tf.keras.regularizers.l2(0.03)))
model.add(layers.Dense(1,kernel_initializer='random_normal',kernel_regularizer=tf.keras.regularizers.l2(0.03)))
model.compile(optimizer=tf.keras.optimizers.SGD(0.001), loss='mean_squared_error')
model.fit(input_features, labels, validation_split=0.25, epochs=100, batch_size=64)
部分打印结果:
Epoch 99/100 261/261 0s 42us/sample - loss: 26.2268 - val_loss: 20.5562
Epoch 100/100 261/261 0s 42us/sample - loss: 24.3962 - val_loss: 21.1083
很显然结果更好了
7、展示测试结果
# 转换日期格式
dates = [str(int(year)) + '-' + str(int(month)) + '-' + str(int(day)) for year, month, day in zip(years, months, days)]
dates = [datetime.datetime.strptime(date, '%Y-%m-%d') for date in dates]# 创建一个表格来存日期和其对应的标签数值
true_data = pd.DataFrame(data = {'date': dates, 'actual': labels})# 同理,再创建一个来存日期和其对应的模型预测值
months = features[:, feature_list.index('month')]
days = features[:, feature_list.index('day')]
years = features[:, feature_list.index('year')]test_dates = [str(int(year)) + '-' + str(int(month)) + '-' + str(int(day)) for year, month, day in zip(years, months, days)]test_dates = [datetime.datetime.strptime(date, '%Y-%m-%d') for date in test_dates]predictions_data = pd.DataFrame(data = {'date': test_dates, 'prediction': predict.reshape(-1)}) # 真实值
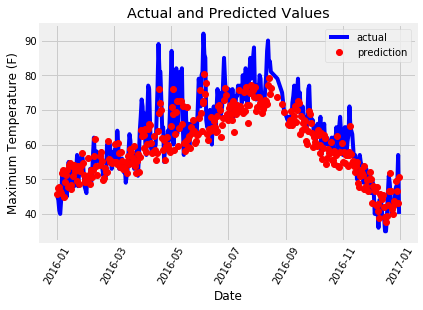
plt.plot(true_data['date'], true_data['actual'], 'b-', label = 'actual')# 预测值
plt.plot(predictions_data['date'], predictions_data['prediction'], 'ro', label = 'prediction')
plt.xticks(rotation = '60');
plt.legend()# 图名
plt.xlabel('Date'); plt.ylabel('Maximum Temperature (F)'); plt.title('Actual and Predicted Values');
)

)


)


)

)