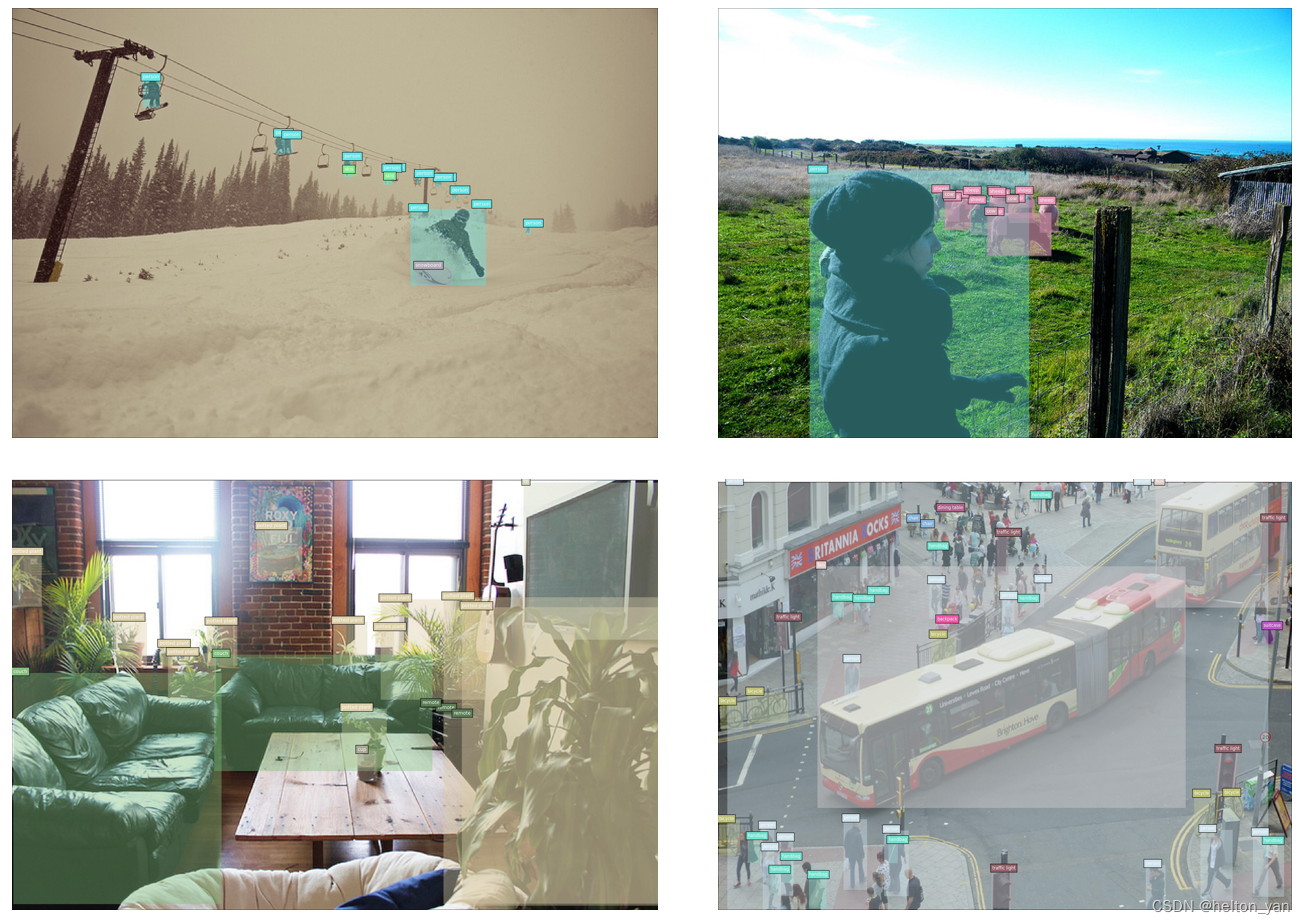
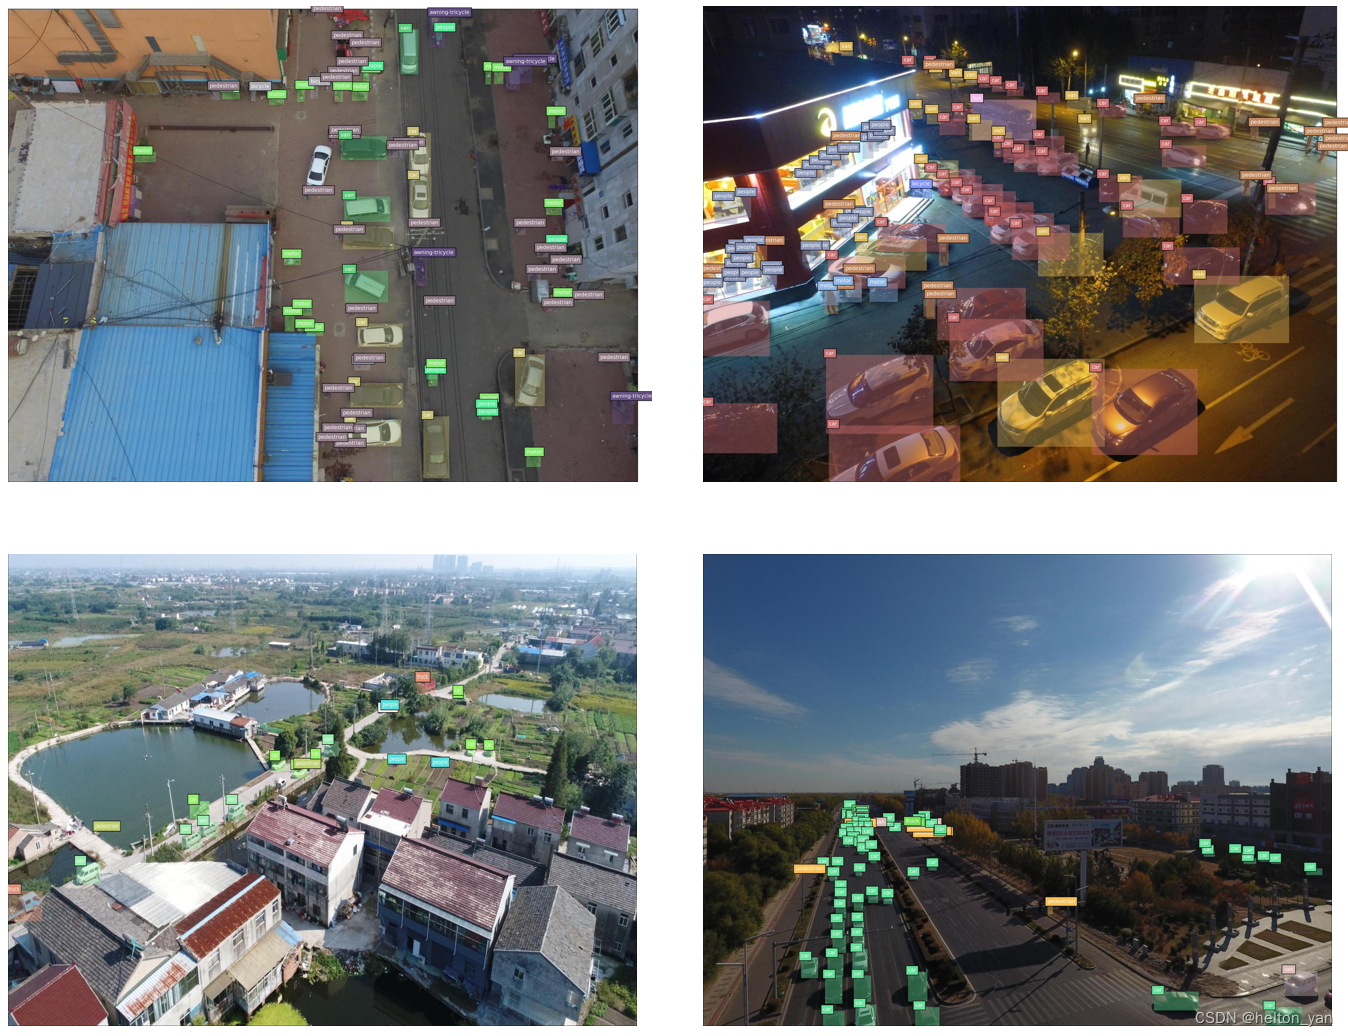
可以用于排查数据集转化后可能出现的坐标错误,类别不对齐等需要可视化才能发现的问题
import部分
from pycocotools.coco import COCO
import numpy as np
import os
from PIL import Image
from matplotlib.collections import PatchCollection
from matplotlib.patches import Polygon
import matplotlib.pyplot as plt
VisCOCOBox
class VisCOCOBox:def visCOCOGTBoxPerImg(self, coco, image2color, anns):'''可视化COCO数据集下一张图像的所有GTBoxesArgs::param coco: COCO数据集实例:param image2color: 每个类别的颜色:param anns: 当前图像对应的GTBoxes信息Retuens:None'''# 获取当前正在使用的坐标轴对象"get current axis"(这里就是图像的坐标轴)ax = plt.gca()# 关闭plt的坐标轴自动缩放功能:# ax.set_autoscale_on(False)# polygons存储plt的多边形实例(即bbox), colors存储每个bbox对应的颜色(区分不同的类别)polygons, colors = [], []for ann in anns:color = image2color[ann['category_id']]x, y, w, h = ann['bbox']# 采用多边形画法:poly = [[x, y], [x, y + h], [x + w, y + h], [x + w, y]]polygons.append(Polygon(np.array(poly).reshape((4,2))))colors.append(color)# 可视化每个bbox的类别的文本(ax.text的bbox参数用于调整文本框的样式):ax.text(x, y, f"{coco.loadCats(ann['category_id'])[0]['name']}", color='white', bbox=dict(facecolor=color))# PatchCollection批量绘制图形, 而不是单独绘制每一个(采用填充,透明度为alpha)p = PatchCollection(polygons, facecolor=colors, linewidths=0, alpha=0.4)ax.add_collection(p)# 批量可视化coco格式数据集的GTdef visCOCOGTBoxes(self, jsonPath, imgDir, visNum, saveVisDir):'''批量可视化数据集GTBoxes(可以用于排查画框等错误)Args::param jsonPath: COCO格式Json文件路径:param imgDir: 图像根目录:param visNum: 可视化几张图像:param saveVisDir: 可视化图像保存目录Retuens:None'''if not os.path.isdir(saveVisDir):os.makedirs(saveVisDir)# 创建COCO数据集读取实例:coco = COCO(jsonPath)# 每个类别都获得一个随机颜色:image2color = dict()for cat in coco.getCatIds():image2color[cat] = (np.random.random((1, 3)) * 0.7 + 0.3).tolist()[0]# 获取数据集中所有图像对应的imgId:imgId = coco.getImgIds()# 打乱数据集图像读取顺序:np.random.shuffle(imgId)for i in range(visNum):plt.figure(figsize=(20, 13))# 获取图像信息(json文件 "images" 字段)imgInfo = coco.loadImgs(imgId[i])[0]imgPath = os.path.normpath(os.path.join(imgDir, imgInfo['file_name']))# 这里win和linux或许不一样:imgName = imgPath.split('\\')[-1]# 得到当前图像里包含的BBox的所有idannIds = coco.getAnnIds(imgIds=imgInfo['id'])# anns (json文件 "annotations" 字段)anns = coco.loadAnns(annIds)# 读取图像image = Image.open(imgPath).convert('RGB')plt.imshow(image)# 画框:self.visCOCOGTBoxPerImg(coco, image2color, anns)# 样式:plt.xticks([])plt.yticks([])plt.tight_layout()# 保存可视化结果plt.savefig(os.path.join(saveVisDir, f'vis_{imgName}'), bbox_inches='tight', pad_inches=0.0, dpi=150)
example
if __name__ == '__main__':jsonPath = 'E:/datasets/RemoteSensing/visdrone2019/annotations/train.json'imgDir = 'E:/datasets/RemoteSensing/visdrone2019/images/train/images'saveVisDir = './vis1'COCOVis = VisCOCOBox()COCOVis.visCOCOGTBoxes(jsonPath, imgDir, 4, saveVisDir)
输出(COCO2017数据集train):

输出(VisDrone2019数据集):


)
复习提纲7)


)
)


pro中配置gstreamer库和头文件路径)


