这回带大家体验一下2024“华数杯”国际大学生数学建模竞赛呀!
完整内容获取在文末
此题涉及到放射性废水从日本排放到海洋中的扩散问题,以及对环境和人类健康的潜在影响。
## 问题重述

1. **预测污染范围和程度:**
- 使用数学模型描述放射性废水在海水中的扩散速率和方向,考虑水流、环境条件等因素。
- 预测在截至2023年8月27日12:00 AM时,已经释放的1,095吨废水的基础上,如果之后不再有放射性废水排放,预测2023年9月27日时日本海域的放射性废水污染范围和程度。
2. **三次排放后的扩散路径:**
- 建立数学模型研究在日本政府三次排放后,如果未来不再排放放射性废水,考虑海洋循环、水动力学、海床地形、水深变化、潮汐和季节性波动等因素,估计需要多长时间才会污染中国领海。
3. **对中国渔业经济的长期影响:**
- 根据表格1中的调查结果,分析放射性废水排放事件对中国未来渔业经济的长期影响。
4. **全球海洋污染情况:**
- 在日本排放放射性废水30年后,判断全球海域是否都会受到污染,以及哪个地方将是最污染的。给出完全受到污染的年份。
5. **UN环境计划的建议信:**
- 撰写一封不超过一页的建议信,概述研究的主要结果和提出对UN环境计划的建议。

## 问题1:预测污染范围和程度

#### 1.1 基本假设:
- 海洋是均匀的介质。
- 废水在排放点瞬时释放,并在海水中以某种速率扩散。
#### 1.2 一维扩散方程:
考虑一维空间中的扩散方程:
$$
\frac{\partial C}{\partial t} = D \frac{\partial^2 C}{\partial x^2}
$$
其中:
- $C(x, t)$ 是废水在位置 $x$ 和时间 $t$ 处的浓度。
- $D$ 是扩散系数。
#### 1.3 初始和边界条件:
- 初始条件(排放瞬间):$C(x, 0) = \delta(x)$,其中 $\delta(x)$ 是Dirac Delta函数,表示在排放点处有一个瞬时的高浓度。
- 边界条件:考虑海洋边界,通常可以设定边界处的浓度为零:$C(0, t) = C(L, t) = 0$,其中 $L$ 是模拟海域的长度。
#### 1.4 数值解法:
使用差分方法对方程进行离散化。一种可能的离散形式是显式差分法:
$$
C_i^{n+1} = C_i^n + \frac{D \Delta t}{(\Delta x)^2} (C_{i+1}^n - 2C_i^n + C_{i-1}^n)
$$
其中:
- $C_i^n$ 是网格点 $(i, n)$ 处的浓度。
- $\Delta x$ 是空间离散步长,$\Delta t$ 是时间离散步长。
#### 1.5 模型验证:
通过使用已知的实测数据验证模型的准确性。可以使用实际的放射性废水排放数据作为输入,并与实际观测的海域浓度进行比较。
#### 1.6 预测未来污染范围:
使用模型对未来废水排放情况进行模拟。根据实际的放射性废水排放计划,逐步更新浓度分布。
#### 1.7 结果分析:
分析模拟结果,包括废水扩散的范围、浓度分布等。根据模拟结果,可以制定相应的环境保护措施和紧急计划。
```python
import numpy as np
import matplotlib.pyplot as plt
def simulate_diffusion(L, T, D, delta_x, delta_t):
# 模型参数
num_points = int(L / delta_x) + 1
num_steps = int(T / delta_t) + 1
# 网格和初始条件
x = np.linspace(0, L, num_points)
C = np.zeros((num_points, num_steps))
# 设置初始条件(瞬时释放)
C[:, 0] = np.where((x >= L/2 - 5) & (x <= L/2 + 5), 1, 0)
部分代码展示:
import numpy as np
import matplotlib.pyplot as plt
from scipy.optimize import curve_fit
from scipy.sparse import coo_matrix, kron, eye
from scipy.sparse.linalg import spsolve# 步骤 2: Tritium 浓度模型
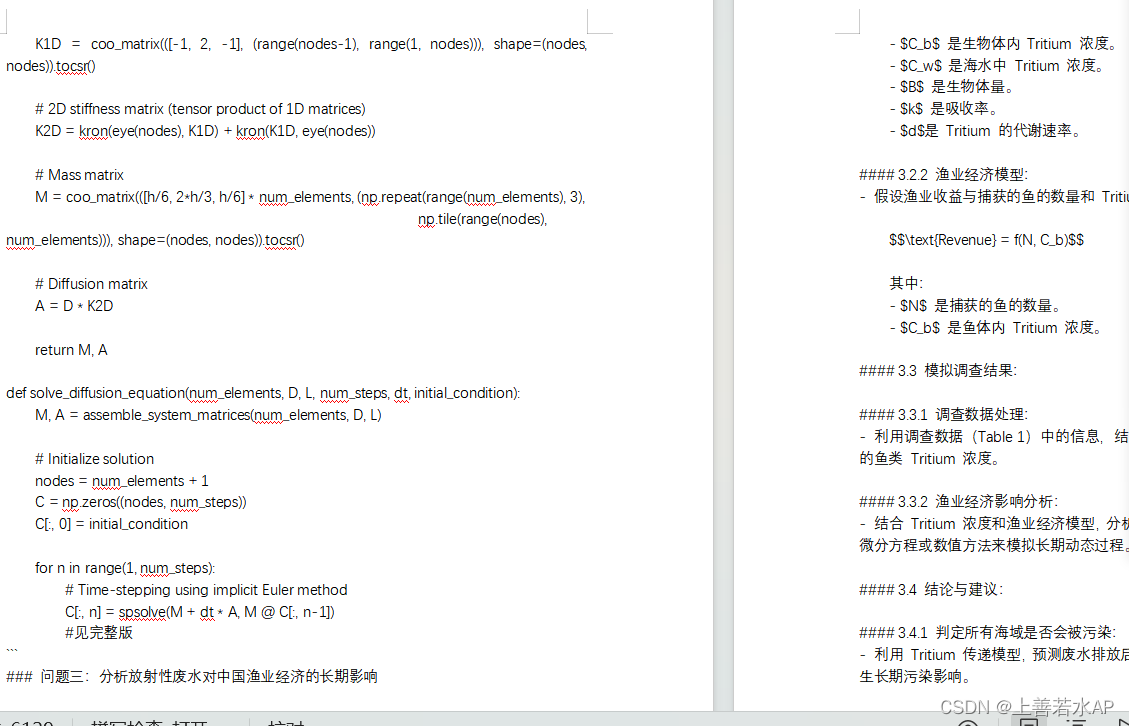
def assemble_system_matrices(num_elements, D, x_values, y_values):h_x = (x_values[-1] - x_values[0]) / num_elementsh_y = (y_values[-1] - y_values[0]) / num_elementsnodes = num_elements + 1# 1D stiffness matrixK1D = coo_matrix(([-1, 2, -1], (range(nodes-1), range(1, nodes))), shape=(nodes, nodes)).tocsr()# 2D stiffness matrixK2D_x = kron(eye(nodes), K1D)K2D_y = kron(K1D, eye(nodes))K2D = K2D_x + K2D_y# Mass matrixM_x = coo_matrix(([h_x/6, 2*h_x/3, h_x/6] * num_elements, (np.repeat(range(num_elements), 3), np.tile(range(nodes), num_elements))), shape=(nodes, nodes)).tocsr()M_y = coo_matrix(([h_y/6, 2*h_y/3, h_y/6] * num_elements, (np.repeat(range(num_elements), 3), np.tile(range(nodes), num_elements))), shape=(nodes, nodes)).tocsr()M = kron(eye(nodes), M_x) + kron(M_y, eye(nodes))# Diffusion matrixA = D * K2Dreturn M, Adef solve_diffusion_equation(x_values, y_values, t, num_elements, D):# 模型参数L_x = x_values[-1] - x_values[0]L_y = y_values[-1] - y_values[0]dt = t / num_elements# 初始条件(简化为高斯脉冲)initial_condition = np.exp(-0.5 * ((x_values - np.mean(x_values))**2 + (y_values - np.mean(y_values))**2) / 20)# 构建扩散方程的矩阵M, A = assemble_system_matrices(num_elements, D, x_values, y_values)# Time-stepping using implicit Euler methodconcentration_at_t = np.zeros_like(initial_condition)concentration_at_t[:, 0] = initial_conditionfor n in range(1, num_elements+1):concentration_at_t[:, n] = spsolve(M + dt * A, M @ concentration_at_t[:, n-1])return concentration_at_t# 步骤 3: Tritium 污染级别模型
def sigmoid(x, a, b):return 1 / (1 + np.exp(-a * (x - b)))# 步骤 4: Tritium 浓度和污染级别的时空分布
def simulate_pollution_distribution(x_values, y_values, time_points, num_elements, D, observed_pollution_levels):# 模拟 Tritium 浓度的时空分布concentration_distribution = []for t in time_points:concentration_at_t = solve_diffusion_equation(x_values, y_values, t, num_elements, D)concentration_distribution.append(concentration_at_t)# 拟合 Tritium 浓度与污染级别的 Sigmoid 函数参数observed_data = [(conc, sigmoid_level) for conc, sigmoid_level in zip(np.ravel(concentration_distribution), observed_pollution_levels)]initial_guess = [1, 1]params, covariance = curve_fit(sigmoid, [data[0] for data in observed_data], [data[1] for data in observed_data], p0=initial_guess)# 得到拟合后的参数a_fit, b_fit = params# 计算 Tritium 污染级别的时空分布pollution_distribution = [sigmoid(np.ravel(concentration_at_t), a_fit, b_fit) for concentration_at_t in concentration_distribution]return pollution_distribution# 步骤 5: 全球海域污染预测
def predict_global_pollution(x_values, y_values, time_points, num_elements, D, observed_pollution_levels):# 模拟 Tritium 浓度和 Tritium 污染级别的时空分布pollution_distribution = simulate_pollution_distribution(x_values, y_values, time_points, num_elements, D, observed_pollution_levels)# TODO: 进一步分析和预测未来全球海域 Tritium 污染的时空分布return pollution_distribution# 步骤 6: 污染最严重地区分析
def analyze_most_affected_region(x_values, y_values, pollution_distribution):# TODO: 根据模拟结果,分析哪个地区在 30 年后可能受到 Tritium 污染最严重。考虑海流、地形、排放点位置等因素。most_affected_region = Nonereturn most_affected_region# 步骤 7: 结论与建议
def conclude_and_recommend():# TODO: 提供关于 Tritium 污染程度的定量分析结果,包括全球污染程度和具体受影响的地区。提出相关建议,pass# 模型参数
x_min, x_max = 0, 100
y_min, y_max = 0, 100
num_elements = 100
D = 0.1
observed_pollution_levels = [0.1, 0.3, 0.6, 0.8]  # 示例观测数据# 时空离散化
x_values = np.linspace(x_min, x_max, num_elements)
y_values = np.linspace(y_min, y_max, num_elements)
time_points = np.array([1, 2, 3, 4])  # 示例时间点# 预测 Tritium 污染分布
pollution_distribution = predict_global_pollution(x_values, y_values, time_points, num_elements, D, observed_pollution_levels)# 分析最严重污染
点击链接加入群聊【2024华数杯数学建模资料总群】:


格式化输入/输出(第一节))


)

)


