第一种代码(失败代码)
import matplotlib as mpl
import matplotlib.pyplot as plt
from matplotlib.font_manager import FontPropertiesfont_path = '/Users/huangbaixi/Desktop/SimHei.ttf'def plot_demo():#print(mpl.get_cachedir())# 绘制折线图font_prop = FontProperties(fname=font_path)plt.rcParams['font.sans-serif'] = [font_prop.get_name()]plt.rcParams['axes.unicode_minus'] = Falseyear = [2017, 2018, 2019, 2020]people = [20, 40, 60, 70]# 生成图表plt.plot(year, people)plt.xlabel('年份')plt.ylabel('人口')plt.title('人口增长')# 设置纵坐标刻度plt.yticks([0, 20, 40, 60, 80])# 设置填充选项:参数分别对应横坐标,纵坐标,纵坐标填充起始值,填充颜色plt.fill_between(year, people, 20, color='green')# 显示图表# plt.savefig("./plt.png")plt.show()
这一版代码会出现
findfont: Generic family ‘sans-serif’ not found because none of the following families were found: SimHei
查询发现:

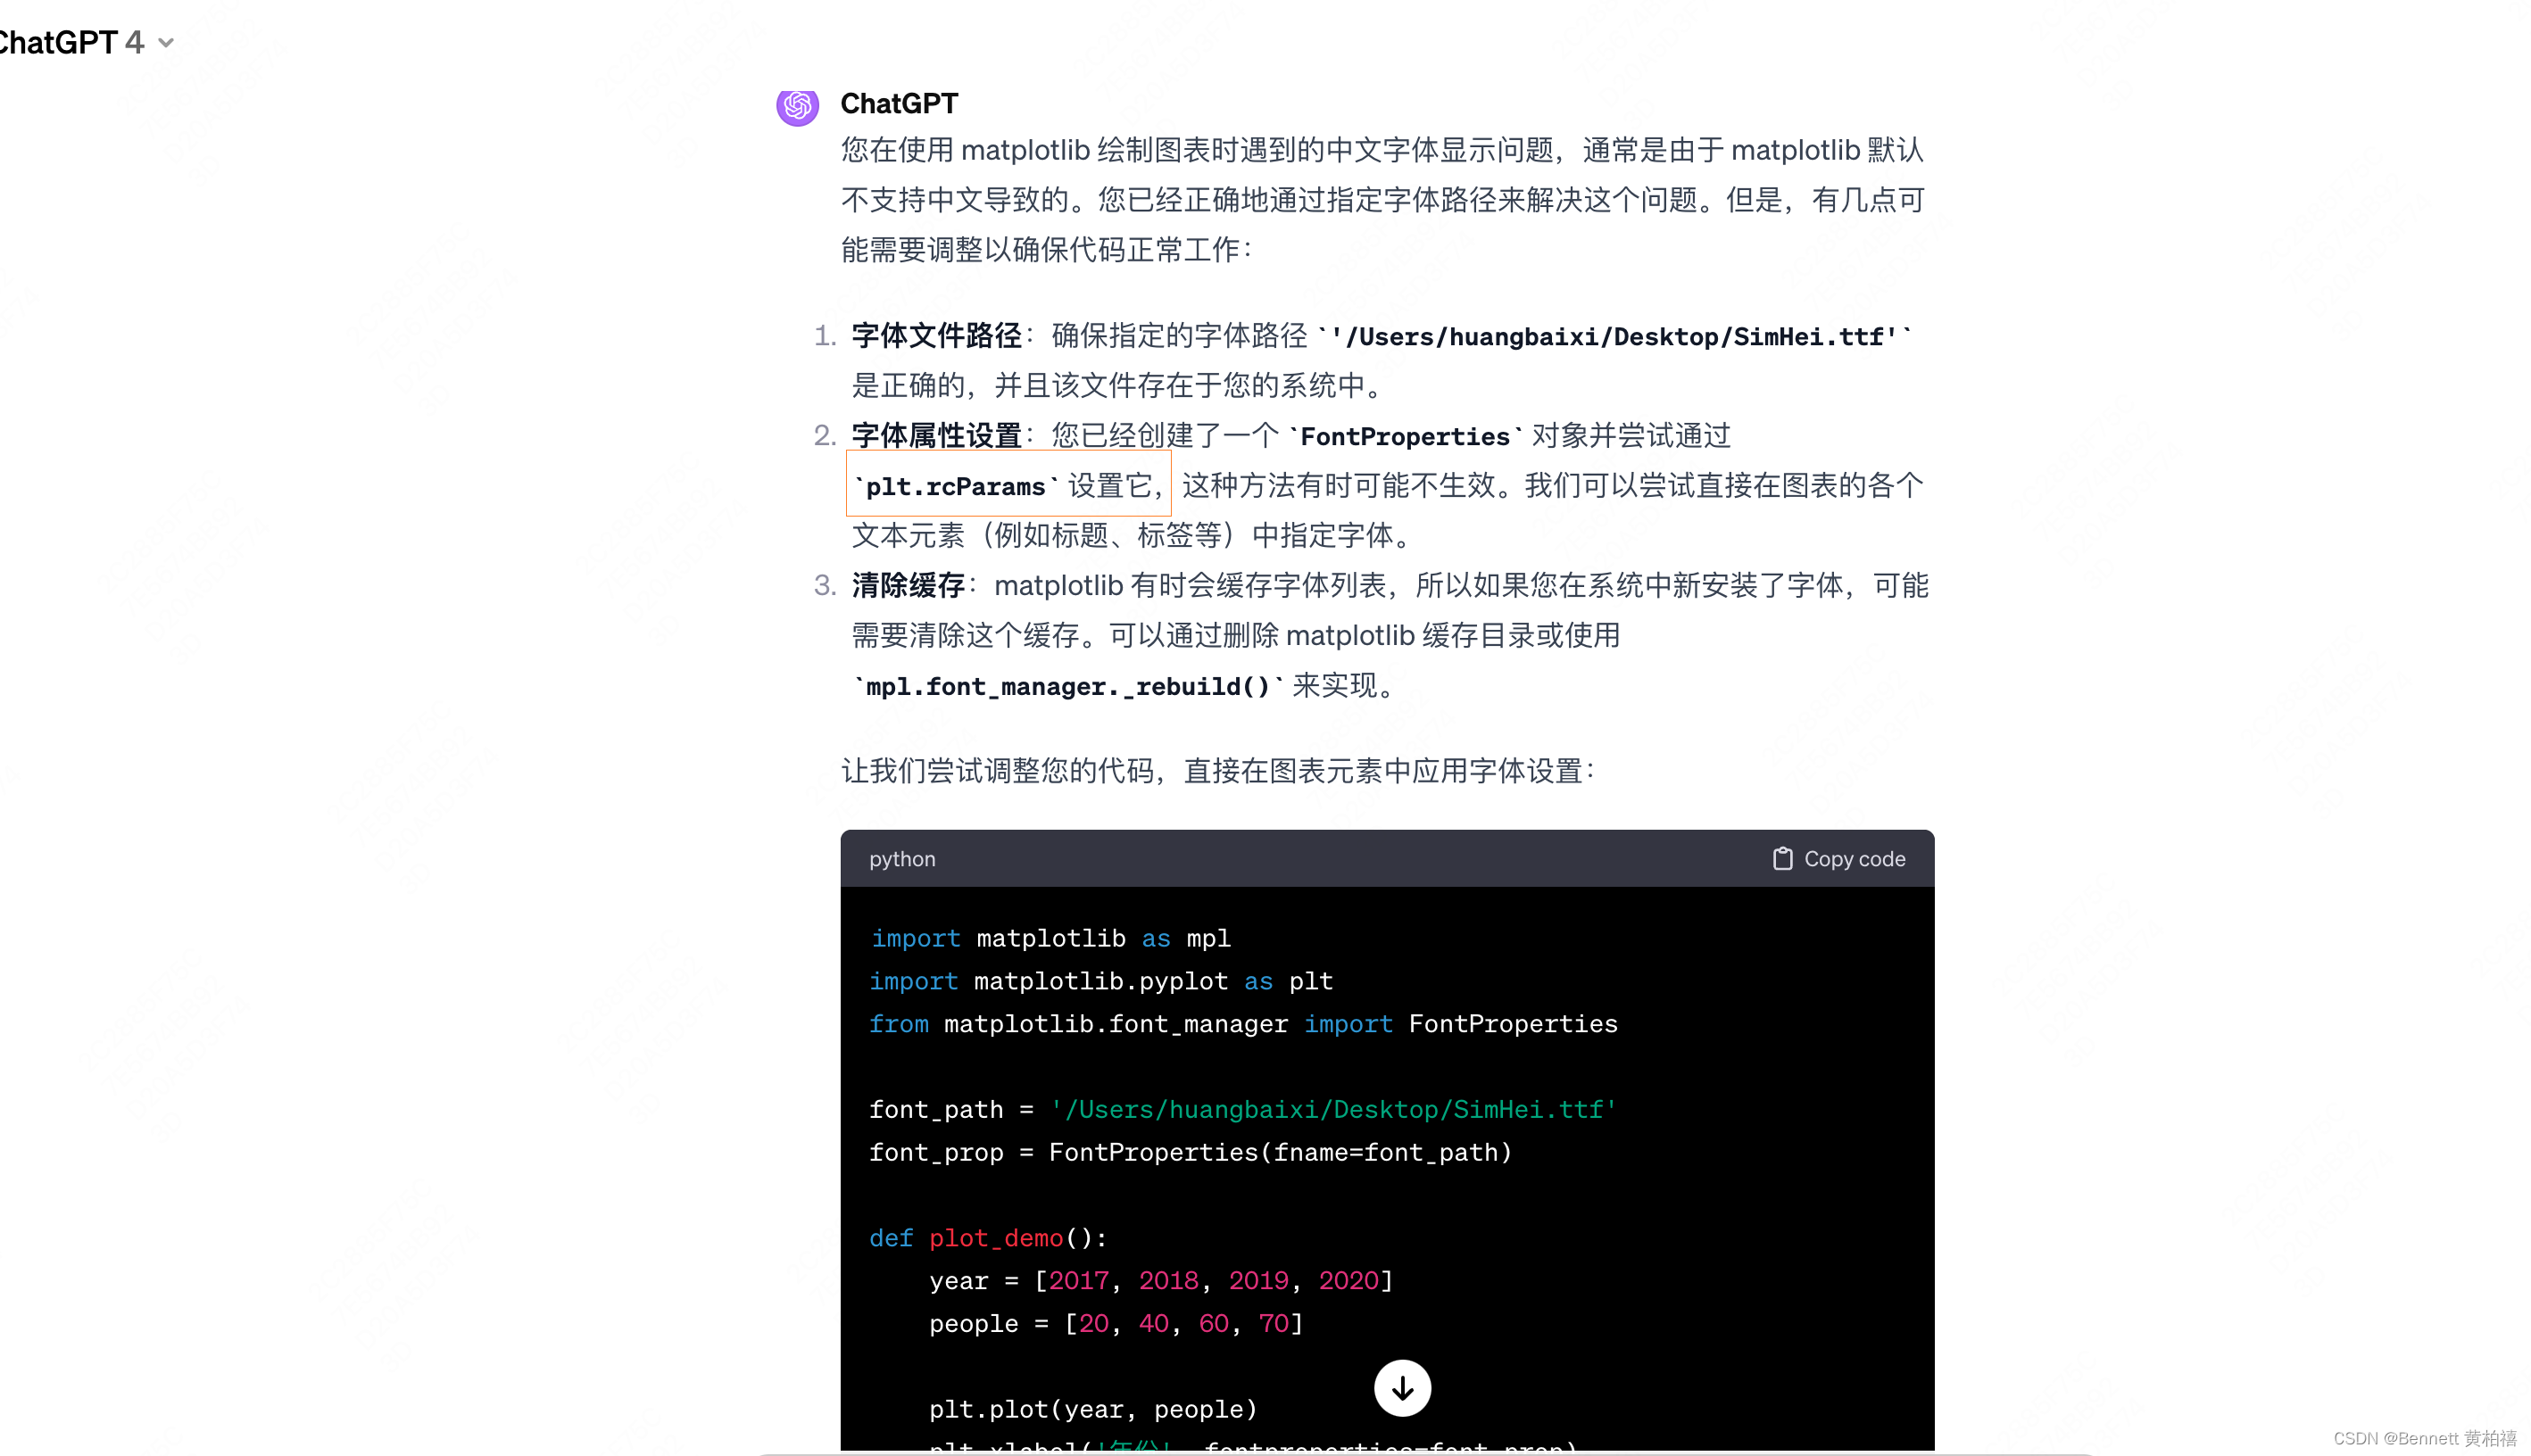
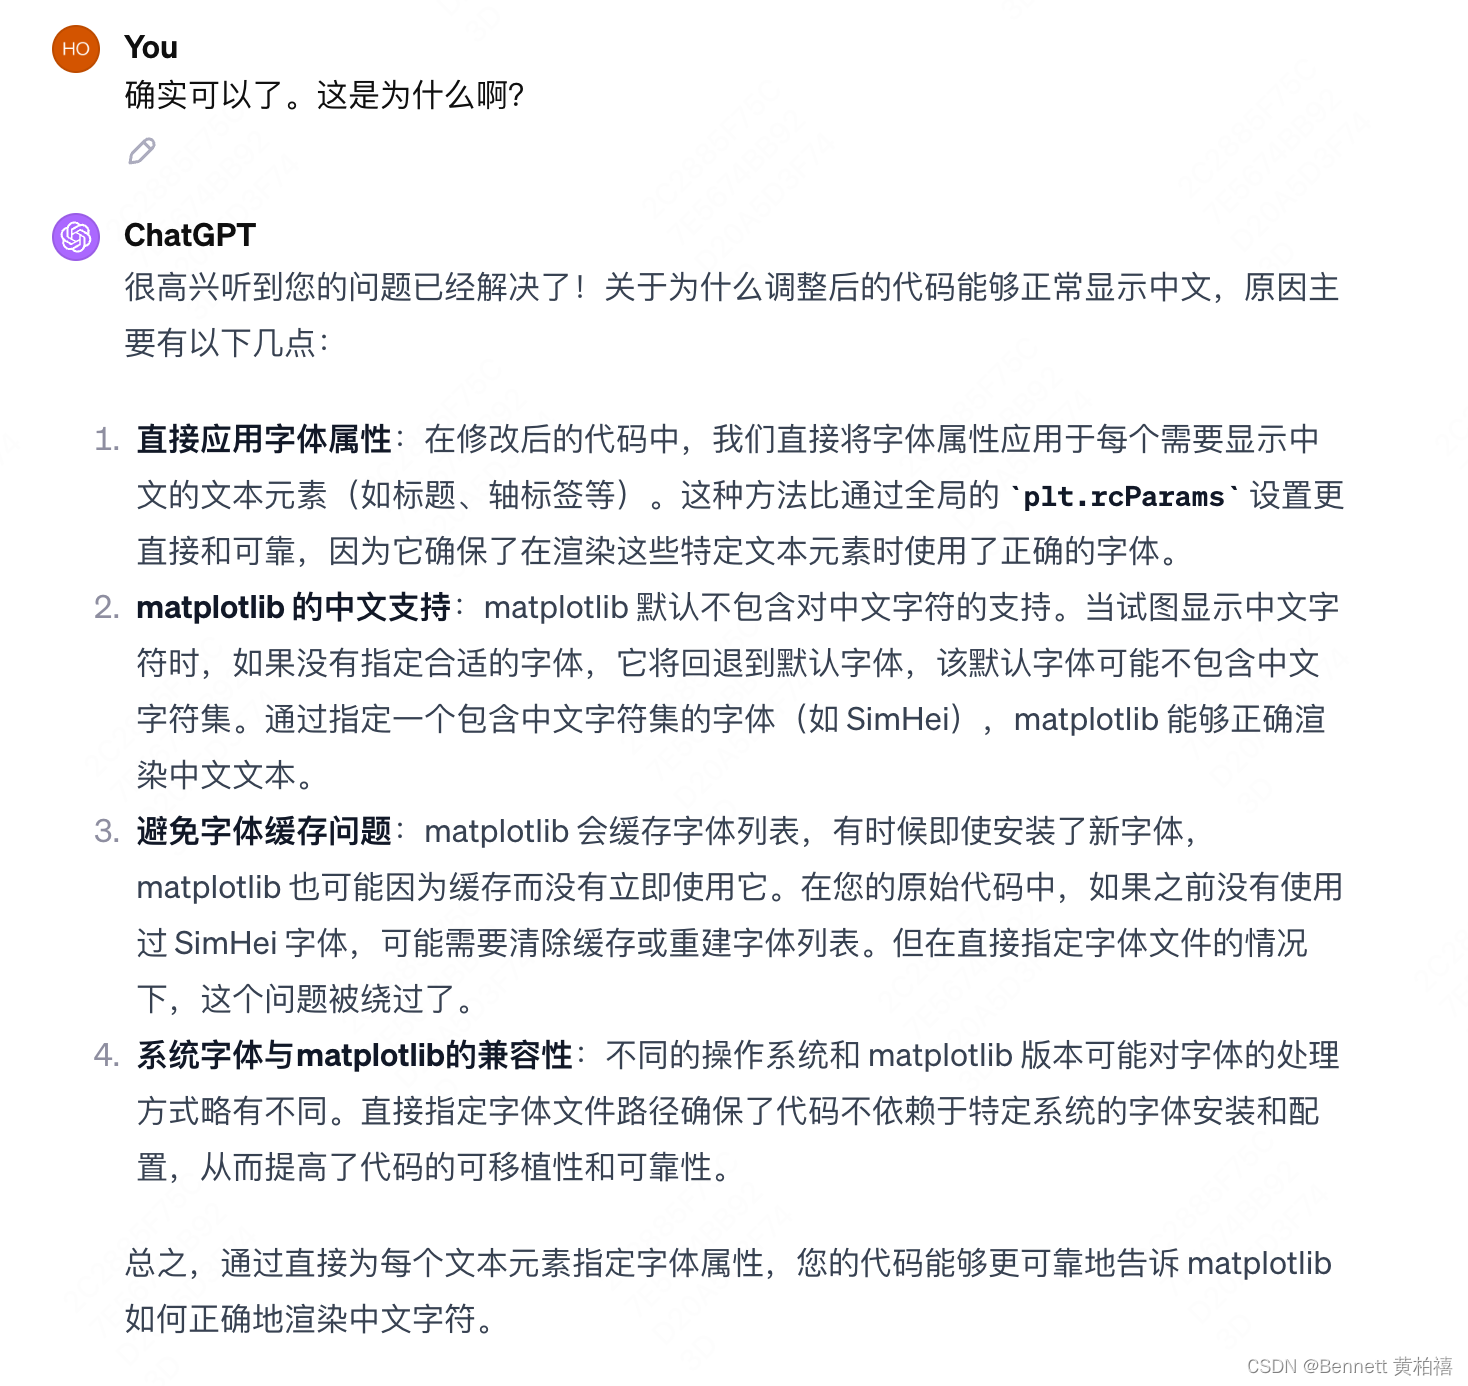
rcParams 有概率失败
第二种方法(指定应用)
import matplotlib as mpl
import matplotlib.pyplot as plt
from matplotlib.font_manager import FontPropertiesfont_path = '/Users/huangbaixi/Desktop/SimHei.ttf'
font_prop = FontProperties(fname=font_path)def plot_demo():year = [2017, 2018, 2019, 2020]people = [20, 40, 60, 70]plt.plot(year, people)plt.xlabel('年份', fontproperties=font_prop)plt.ylabel('人口', fontproperties=font_prop)plt.title('人口增长', fontproperties=font_prop)plt.yticks([0, 20, 40, 60, 80])plt.fill_between(year, people, 20, color='green')plt.show()plot_demo()这是成功的。

第三种方法(全局应用)
import matplotlib
# font_path = '/usr/share/fonts/SimHei.ttf'
font_path = '/Users/huangbaixi/Desktop/SimHei.ttf'
# 添加字体路径
matplotlib.font_manager.fontManager.addfont(font_path)# 设置 matplotlib 的全局参数
matplotlib.rcParams['font.family'] = 'sans-serif'
matplotlib.rcParams['font.sans-serif'] = ['SimHei']  # 使用 SimHei 字体
matplotlib.rcParams['axes.unicode_minus'] = False  # 正常显示负号# 定义绘图函数
def plot_demo():year = [2017, 2018, 2019, 2020]people = [20, 40, 60, 70]plt.plot(year, people)plt.xlabel('年份')plt.ylabel('人口')plt.title('人口增长')plt.yticks([0, 20, 40, 60, 80])plt.fill_between(year, people, 20, color='green')plt.show()
这也是可以的。


是什么?)


![【Dart】=> [06] Dart初体验-类Class-构造函数-继承-mixin-异步编程-链式调用-泛型-异常](http://pic.xiahunao.cn/【Dart】=> [06] Dart初体验-类Class-构造函数-继承-mixin-异步编程-链式调用-泛型-异常)
斯坦福CS231n学习笔记:DL与CV教程 (1) | 引言与知识基础)


