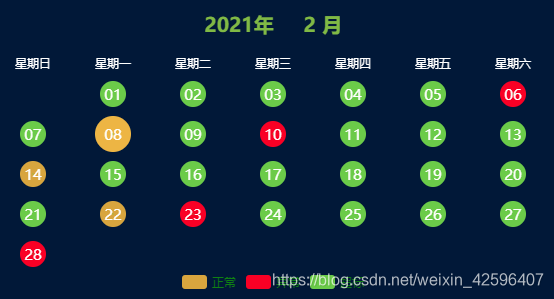
在使用案例的echart的日历图表的时候,遇到了:
Uncaught TypeError: Cannot read property ‘queryComponents’ of undefined

思考了很久,还百度了,结果还是不好使,最后终于被我在一个问答了找到了答案。
刚开始我是这样写的

这样写其实没问题,但是有时候就是会出现加载顺序的问题,所以要在这个方法执行前就setOption一次,这个问题就解决了。

最后出来效果是这样的:

下面贴出我的源码:
$(document).ready(function () {new Vue({el: "#form-box",data: {//网站根路径,用于a标签连接拼接链接全名地址scatterData:[],seriesData:[],scatterCharts:{},cellSize:[],customradius:[],},created: function () {var that = this;layui.use(['layer', 'laytpl', 'element', 'form','table'], function () {that.$ = layui.jquery,that.table = layui.table, that.layer = layui.layer, that.laytpl = layui.laytpl, that.element = layui.element, that.form = layui.form;//加载echart图表that.scatterChart();});},methods: {//日历图表scatterChart:function () {var that = this;that.scatterCharts =  echarts.init(document.getElementById('scatter'));that.cellSize = [80, 40];//这个是控制整个日历的大小that.customradius = [0, 13];//这个控制每个圆圈的大小var dataX = ['星期日', '星期一', '星期二', '星期三', '星期四', '星期五', '星期六'];that.scatterData = that.getVirtulData();//series的数据初始设置scatterthat.seriesData = [{ //日期id: 'label',type: 'scatter',coordinateSystem: 'calendar',symbolSize: 1,label: {show: false,},data: that.scatterData}];var option = {color: ["rgba(104,203,63)","rgba(252,0,25)", "rgba(217,166,50)"],legend: {//color: 'red',data: [{name: "正常",},{name: "异常",},{name: "超标",}],bottom: 10,textStyle: {color: 'green',}},calendar: {//top: 'middle',top: 80,left: 'center',orient: 'vertical',cellSize: that.cellSize,yearLabel: {show: true,margin: 40,color: '#7fb93c',formatter: function(e) {console.log(e);return e.start + "年     2 月";}},dayLabel: {margin: 5,color: '#fff',nameMap: dataX},monthLabel: {show: false},splitLine: {show: false //外部边框},itemStyle: {color: 'rgba(0,0,0,0)',borderWidth: 1,borderColor: 'rgba(0,0,0,0)' //内边框颜色},range: ['2021-02']},series: that.seriesData};// setTimeout(function() {// 	that.getPieSeries()// 	charts.setOption(option)// 	console.log(option);// }, 10);//这个地方2次setOption都是必要的that.scatterCharts.setOption(option);that.getPieSeries(that.scatterCharts);that.scatterCharts.setOption(option);},getVirtulData: function () {var date = +echarts.number.parseDate('2021-02-01');var end = +echarts.number.parseDate('2021-03-01');var dayTime = 3600 * 24 * 1000;var data = [];for (var time = date; time < end; time += dayTime) {data.push([echarts.format.formatTime('yyyy-MM-dd', time),Math.floor(Math.random() * 10000)]);}//alert(data);return data;},getcustomDay:function (e) {let h = e.substr(8, e.length);return h;},getPieSeries:function (myCharts) {var that = this;that.scatterData.map(function (item, index) {//console.log(item);var center = myCharts.convertToPixel('calendar', item);var customname;var customcolor;var customday;customday = that.getcustomDay(item[0]);console.log(customday);if (item[1] < 2000) {customname = "正常";customcolor = 'rgba(104,203,63)';} else if (item[1] < 4000) {customname = "异常";customcolor = 'rgba(217,166,50)';} else {customname = "超标";customcolor = 'rgba(252,0,25)';}var seriesItem = {id: index + 'pie',type: 'pie',center: center,radius: that.customradius,label: {normal: {formatter: '{c}',position: 'center',fontSize: '15',color: '#fff'}},data: [{name: customname,legendHoverLink: false,hoverAnimation: false,value: customday,// itemStyle: {// 	backgroundColor: customcolor// },}]};that.seriesData.push(seriesItem)})}}});
});


