python 散点图 分类
Visualizing different variables is also a part of basic plotting. Such variables can have different classes, for example, numerical or a category. Matplotlib has an important feature of Categorical Plotting. We can plot multiple categorical variables within different types of plots such as line, dot, bar, scatter, etc.
可视化不同的变量也是基本绘图的一部分。 这样的变量可以具有不同的类别,例如,数值或类别。 Matplotlib具有分类绘图的重要功能。 我们可以在不同类型的图中绘制多个类别变量,例如线,点,条,散点图等。
Following are some examples of categorical plotting:
以下是分类绘图的一些示例 :
Syntax:
句法:
matplotlib.pyplot.figure(figsize=(4,3))
#figsize(float, float)
width, height in inches.
示例1:线图 (Example 1: Line Plot)
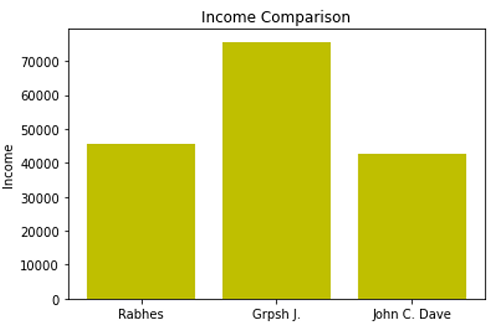
示例2:条形图 (Example 2: Bar Plot)

示例3:点图 (Example 3: Dot Plot)
用于分类绘图的Python代码 (Python code for categorical plotting)
# Data Visualization using Python
# Categorical Plotting
import matplotlib.pyplot as plt
names = ['Rabhes', 'Grpsh J.', 'John C. Dave']
values = [45646, 75640, 42645]
# example 1
plt.figure()
plt.plot(names, values, color='y')
plt.ylabel('Income')
plt.title('Income Comparison')
plt.show()
# example 2
plt.figure()
plt.bar(names, values, color='y')
plt.ylabel('Income')
plt.title('Income Comparison')
plt.show()
# example 3
plt.figure()
plt.plot(names, values, 'or')
plt.ylabel('Income')
plt.title('Income Comparison')
plt.show()
Output:
输出:
Output is as figure
翻译自: https://www.includehelp.com/python/categorical-plotting.aspx
python 散点图 分类


?)


