python 绘制三角函数
Trigonometry is one of the most important parts in engineering and many times, therefore matplotlib.pyplot in combination with NumPy can help us to plot our desired trigonometric functions. In this article, we are going to introduce a few examples of trig-functions.
三角学是工程学中最重要的部分之一,因此, matplotlib.pyplot与NumPy结合可以帮助我们绘制所需的三角函数。 在本文中,我们将介绍一些三角函数的例子。
1)正弦函数 (1) Sine Function)
s = np.sin(t)
fig, ax = plt.subplots()
ax.plot(t, s)
ax.set(xlabel='radians', ylabel='Sin(x)',
title='Sine Plot')
ax.grid()
plt.show()
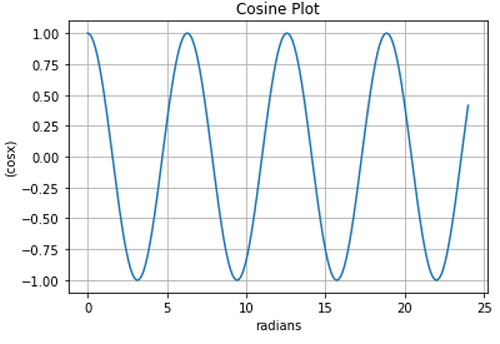
2)余弦函数 (2) Cosine Function)
s = np.cos(t)
fig, ax = plt.subplots()
ax.plot(t, s)
ax.set(xlabel='radians', ylabel='(cosx)',
title='Cosine Plot')
ax.grid()
plt.show()

3)切线函数 (3) Tangent Function)
t = np.arange(0.0, 1, 0.01)
s = np.tan(t)
fig, ax = plt.subplots()
ax.plot(t, s)
ax.set(xlabel='radians', ylabel='tan(x)',
title='Tangent Plot')
ax.grid()
plt.show()
用于绘制三角函数的Python代码 (Python code for plotting trigonometric functions)
import matplotlib.pyplot as plt
import numpy as np
# Data for plotting
t = np.arange(0.0, 24, 0.01)
# Sine Plot
s = np.sin(t)
fig, ax = plt.subplots()
ax.plot(t, s)
ax.set(xlabel='radians', ylabel='Sin(x)',
title='Sine Plot')
ax.grid()
plt.show()
# Cosine Plot
s = np.cos(t)
fig, ax = plt.subplots()
ax.plot(t, s)
ax.set(xlabel='radians', ylabel='(cosx)',
title='Cosine Plot')
ax.grid()
plt.show()
# Tangent Plot
t = np.arange(0.0, 1, 0.01)
s = np.tan(t)
fig, ax = plt.subplots()
ax.plot(t, s)
ax.set(xlabel='radians', ylabel='tan(x)',
title='Tangent Plot')
ax.grid()
plt.show()
Output:
输出:
Output is as figure
翻译自: https://www.includehelp.com/python/plotting-trigonometric-functions.aspx
python 绘制三角函数
》一2.3.3 把查询模板保存到文件)


方法与示例)
)
方法与示例)
)

方法与示例)
)

方法与示例)


方法与示例)


方法与示例)

方法与示例)