一、柱状图
1.通过obj.plot()
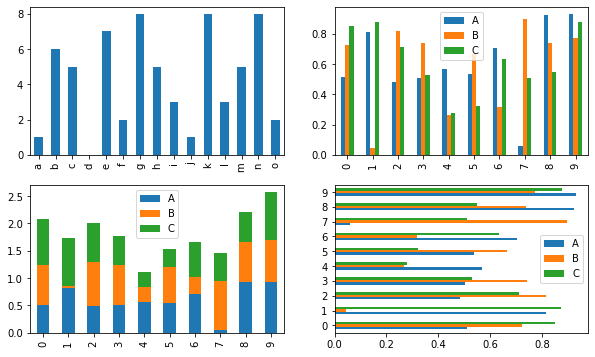
柱状图用bar表示,可通过obj.plot(kind='bar')或者obj.plot.bar()生成;在柱状图中添加参数stacked=True,会形成堆叠图。
fig,axes = plt.subplots(2,2,figsize=(10,6))
s = pd.Series(np.random.randint(0,10,15),index = list('abcdefghijklmno'))
df = pd.DataFrame(np.random.rand(10,3),columns = ['A','B','C'])
s.plot(kind = 'bar',ax = axes[0,0]) #kind表示图表类型
df.plot(kind = 'bar',ax = axes[0,1])
df.plot.bar(ax = axes[1,0],stacked = True)   #stacked = True表示显示为堆叠样式
df.plot.barh(ax = axes[1,1])  #横向的柱状图
2.通过plt.bar(x,y)
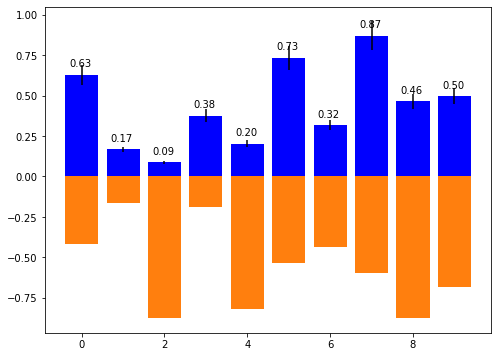
直接使用plt.bar()时,需要在参数中指定x轴和y轴表示的数据。
plt.figure(figsize=(8,6))
x = np.arange(10)
y1 = np.random.rand(10)
y2 = -np.random.rand(10)plt.bar(x,y1,yerr = 0.1 * y1)
for i,j in zip(x,y1):plt.text(i-0.3,j+0.05,'%.2f'%j)  #添加标签-0.3和+0.05是为了让标签的位置更合理

plt.bar(x,y2)
柱状图外嵌图表
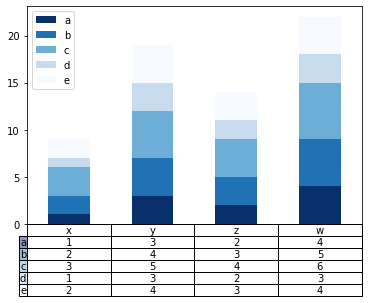
通过plt.table()可以实现在柱状图下方附上表格的功能。
plt.table(cellText=data.T,cellLoc='center',cellColours=None,rowLabels=cols,rowLoc='center',colLabels=rows,colLoc='center',loc='bottom')
- cellText:表格内容,通常为DataFrame的values部分
- cellLoc:表格内容的对齐方式,通常为center居中对齐
- cellColours:表格内容背景颜色
- rowLabels:行标签
- rowLoc:行标签的对齐方式
- colLabels:行标签的背景颜色
- colLoc:列标签的对齐方式
- loc:表格位置,常用bootom,
data = np.array([[1,2,3,1,2],[3,4,5,3,4],[2,3,4,2,3],[4,5,6,3,4]])
rows = ['x','y','z','w']
cols = ['a','b','c','d','e']
df = pd.DataFrame(data,index = rows,columns=cols)
df.plot(kind='bar',stacked=True,colormap='Blues_r')
plt.xticks([])  #去掉x轴的刻度标签,避免与下方的表格的列标签重合
plt.table(cellText=data.T,cellLoc='center',cellColours=None,rowLabels=cols,rowLoc='center',\
rowColours=plt.cm.BuPu(np.linspace(0,0.5,5))[::-1],colLabels=rows,colLoc='center',colColours=None,loc='bottom')
二、面积图
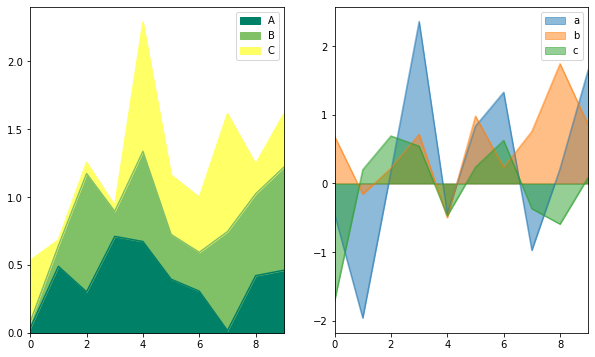
面积图使用obj.plot(kind='area')或者obj.plot.area()生成,没有plt.area()方法。
面积图默认是堆叠的,并且要求值必须同时为正值或同时为负值;如果既有正值也有负值,不能堆叠,需要使用参数stacked=False。
fig,axes = plt.subplots(1,2,figsize=(10,6))
df1 = pd.DataFrame(np.random.rand(10,3),columns=['A','B','C'])
df2 = pd.DataFrame(np.random.randn(10,3),columns=['a','b','c'])
df1.plot.area(colormap='summer',ax = axes[0])
df2.plot(kind='area',stacked = False,ax = axes[1])
三、填图
填充x轴与一个y轴之间的空间:需要y轴与x轴有交叉,否则不会显示
填充两个y轴之间的空间:相当于两个y轴的差
fig,axes = plt.subplots(1,2,figsize=(10,4))
x = np.linspace(0,1,500)
y1 = np.sin(4*np.pi*x)
y2 = -np.sin(4*np.pi*x)
# y1 = 2*x
# y2 = -x  #调成y1和y2都没有效果
axes[0].fill(x,y1,'lightblue',label='y1')
axes[0].fill(x,y2,'pink',label='y2')
axes[1].fill_between(x,y1,y2,color = 'lightblue',label='y1-y2')#此处需要用color指定颜色,直接写颜色会报错

四、饼图
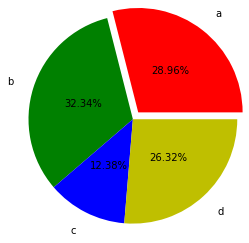
plt.pie(s,explode=None,labels=None,colors=None,autopct=None,pctdistance=0.6,labeldistance=1.1,shadow=False,startangle=None,radius=None,frame=False)
- s:一个Seris
- explode:突出的饼块位置及突出大小
- labels:饼块的标签
- colors:饼块的颜色
- autopct:饼块的值的显示格式
- pctdistance:饼块的值距离圆心的距离,相对于半径来说
- labeldistance:标签距离圆心的距离,相对于半径来说
- shadow:是否显示阴影
- startangle:第一个饼开始的地方,默认从水平线开始逆时针方向进行,30表示从水平方向逆时针旋转30°的地方开始
- radius:半径的长度
s = pd.Series(np.random.rand(4),index=['a','b','c','d'])
plt.axis('equal')  #
plt.pie(s,explode=[0.1,0,0,0],labels=s.index,colors=['r','g','b','y'],autopct='%.2f%%',pctdistance=0.5,\labeldistance=1.2,shadow=False,startangle=0,radius=1.2,frame=False)
五、直方图
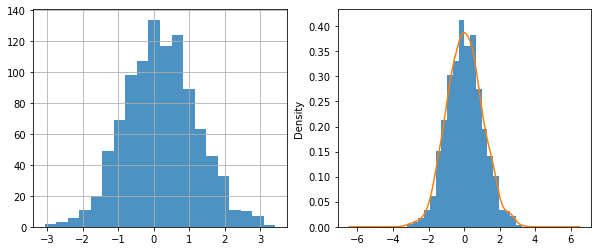
柱状图是用于展示数值的,而直方图是用来统计频率的。
hist(x, bins=None, range=None, density=None, weights=None,cumulative=False, bottom=None, histtype='bar', align='mid',orientation='vertical', rwidth=None,
log=False, color=None,label=None, stacked=False, normed=None, *, data=None,**kwargs)
- bins柱子的数量,即将样本分为多少个组进行统计
- histtype:直方图的风格,默认为bar,其他还有step、stepfilled、barstacked(有时候对于df不起作用,堆叠直方图一般不用s.hist())
- align:对齐方式,默认为mid居中对齐,其他还有left和right
- orientation:方向,默认为vertical竖直方向,其他horizontal
- mormed:密度,默认为False,y轴显示数量,True表示y轴显示为0-1的区间,与密度图类似
- grid:直方图默认有网格
fig,axes = plt.subplots(1,2,figsize=(10,5))
s = pd.Series(np.random.randn(1000))
s.hist(bins=20,histtype='bar',align='right',orientation='vertical',alpha=0.8,density=False,grid=True,ax=axes[0])#四种方式
# s.plot(kind='hist')
# s.plot.hist()
# plt.hist(s,bins=30)
s.hist(bins=20,alpha=0.8,density=True,ax=axes[1]) #直方图形式的密度图
s.plot(kind='kde',ax=axes[1] )#密度图
堆叠直方图,由于直方图的histtype设置为batstacked经常不生效,生成多系列的堆叠直方图常使用df.plot()或df.plot.hist()来生成
df = pd.DataFrame({'A':np.random.randn(1000),'B':np.random.randn(1000),'C':np.random.randn(1000)})
df.plot.hist(stacked=True)
# df.plot(kind='hist',stacked=True)
# df.hist(stacked=True,histtype='barstacked')  #不起作用,生成3个独立的直方图
# plt.hist(df) #无法使用 
六、散点图
plt.scatter(x, y, s=None, c=None, marker=None, cmap=None, norm=None, vmin=None, vmax=None, alpha=None, linewidths=None, verts=None, edgecolors=None, *, plotnonfinite=False, data=None, **kwargs)
# x和y分别表示x轴和y轴数据
# s表示点的大小,可以为一个数值,也可为一变量,为变量则s可表示除x和y的另一个维度
# c表示点的颜色,可以为一具体颜色,也可为一变量,为变量则c可表示除x和y的另一个维度
# vmin和vmax表示亮度的最小和最大值,是一个具体的数值
plt.figure(figsize=(8,5))
x = np.random.randn(1000)
y = np.random.randn(1000)
plt.scatter(x,y,s =np.random.randn(1000)*30,c=np.random.randn(1000)*30,cmap='Reds') #只有这一种方法

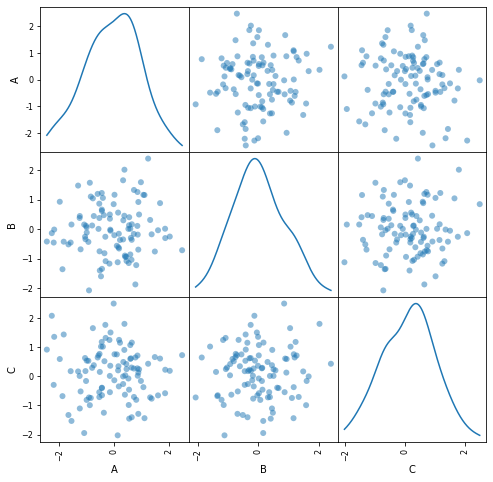
矩阵散点图是pandas中的方法,不是matplotlib中的方法,常用来看各个指标之间的关系。
df = pd.DataFrame(np.random.randn(100,3),columns = ['A','B','C'])
pd.plotting.scatter_matrix(df,figsize=(8,8),diagonal='kde',marker='o',range_padding=0.1)
# 将df的三列进行两两对比,寻找任意两个之间的关系
# diagonal为对角线处的图表显示类型,即每一列自身,常用bar或kde
# range_padding为图表与x轴和y轴之间的空白
七.极坐标图
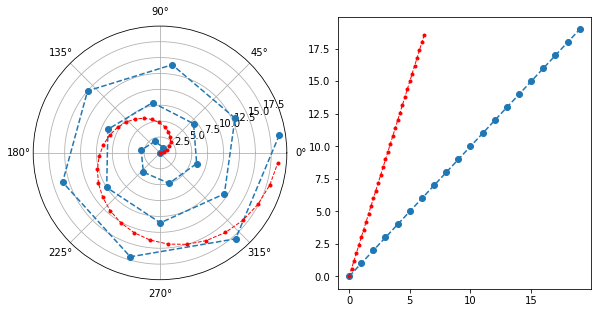
极坐标图是以一个圆盘进行显示的,起点为右侧水平方向的半径,距离起点的角度相当于x轴,距离圆心的距离相当于y轴。


s = pd.Series(np.arange(20))
arr = np.arange(0,2*np.pi,00.2)
fig = plt.figure(figsize=(10,5))
ax1 = plt.subplot(121,polar = True)
# ax1 = fig.add_subplot(121,projection='polar') #polar的两种参数写法等价,表示创建极坐标
ax2 = plt.subplot(122)ax1.plot(s,linestyle='--',marker='o')
ax1.plot(arr,arr*3,linestyle='--',marker='.',color = 'r',lw=1)
ax2.plot(s,linestyle='--',marker='o')
ax2.plot(arr,arr*3,linestyle='--',marker='.',color = 'r',lw=1)
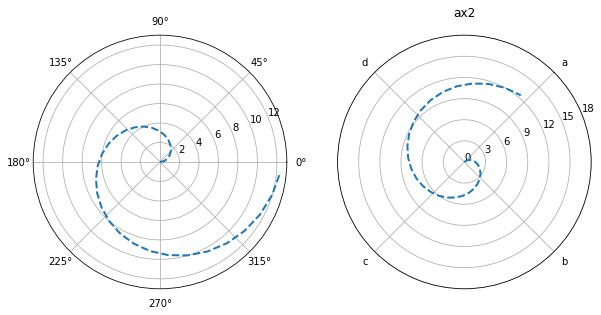
下面以两个对比的例子解释极坐标的相关参数


arr = np.arange(0,2*np.pi,00.2)
fig = plt.figure(figsize = (10,5))
ax1 = fig.add_subplot(121,polar=True)
ax2 = fig.add_subplot(122,polar=True)
ax1.plot(arr,arr*2,linestyle='--',lw=2)
ax2.plot(arr,arr*2,linestyle='--',lw=2)ax2.set_title('ax2') #设置标题
ax2.set_theta_direction(-1) #角度旋转方向,默认为逆时针,-1表示顺时针
ax2.set_thetagrids(np.arange(0,360,90),['a','b','c','d']) #设置极坐标角度网格线(即将圆盘分为几个扇形)显示及标签,标签默认显示为角度
ax2.set_rgrids([0,3,6,9,12,15]) #设置网格线显示(即不同半径的圆)
ax2.set_theta_offset(np.pi/4)  #设值网格起点的角度偏移,默认是水平线右侧为起点,偏移为逆时针方向偏移
ax2.set_rlim(0,18) #设置网格线的显示范围
ax2.set_rmax(18)  #设置极坐标的半径
ax2.set_rticks([0,3,6,9,12,15,18])  #设置网格线的显示范围
在极坐标图中绘制极轴图


arr = np.arange(0,np.pi*2,np.pi*0.2)
data1 = np.random.randint(1,10,10)
fig = plt.figure(figsize = (10,6))
ax1 = plt.subplot(111,polar=True)
bar = ax1.bar(arr,data1,alpha = 0.7)
print(bar,type(bar))  #即一个包含各个扇形的容器,一共10个
# <BarContainer object of 10 artists> <class 'matplotlib.container.BarContainer'>

八、雷达图
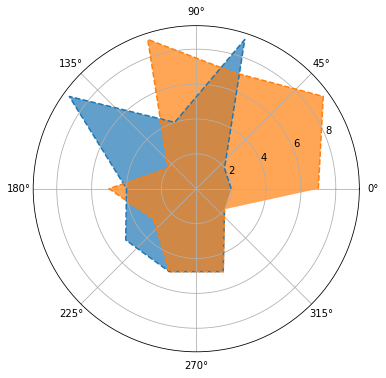
雷达图可以在极坐标图的基础上绘制再填充,也可以直接通过plt.polar()生成。


arr = np.arange(0,np.pi*2,np.pi*0.2)
data1 = np.random.randint(1,10,10)
data2 = np.random.randint(1,10,10)fig1 = plt.figure(figsize=(10,6))
ax1 = fig1.add_subplot(111,polar = True)
ax1.plot(arr,data1,linestyle='--')  #绘制极坐标图,首尾不相连,是折线图
ax1.fill(arr,data1,alpha=0.7)   #将折线图内部填充颜色,看起来就像是首尾相连,但其实首尾之间并没有连接的线
ax1.plot(arr,data2,linestyle='--')
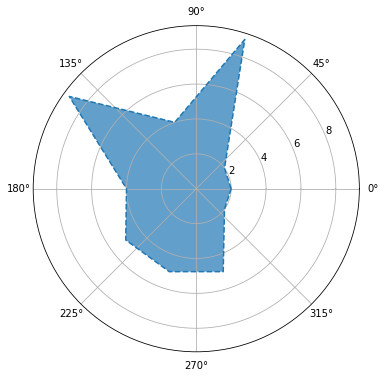
ax1.fill(arr,data2,alpha=0.7)arr = np.concatenate((arr,[arr[0]]))  #将原数据与原数据中的第一个值进行拼接
data1 = np.concatenate((data1,[data1[0]]))  #将原数据与原数据中的第一个值进行拼接
fig2 = plt.figure(figsize=(10,6))
plt.polar(arr,data1,'--')  #直接通过plt.polar绘制,结果是一个首尾相连的图
plt.fill(arr,data1,alpha = 0.7)  #填充内部
九、箱型图
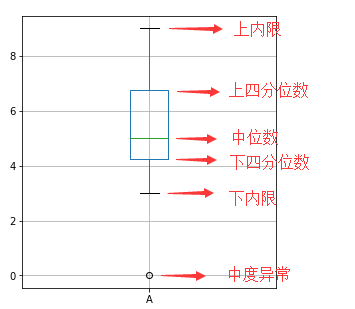
箱形图又称为盒须图、盒式图或箱线图,是一种用于显示一组数据分散情况资料的统计图。
箱型图包含一组数据的最大值(上内限)、最小值(下内限)、中位数、上四分位数、下四分位数和异常值,计算时将数据按照从大到小的顺序排列。
计算四分位的位置有(n+1) / 4和(n-1) / 4两种,一般采用前者。
- 上四分位数:Q3,位置(n+1) / 4,
- 中位数:位置(n+1)/2
- 下四分位数:Q1,位置3*(n+1) / 4,四分位差为上四分位数-下四分位数,即IQR=Q3-Q1
- 内限:箱型图的盒须,上内限最大值为Q3+1.5IQR,下内限最小值为Q1-1.5IQR
- 外限:上外限最大值为Q3+3IQR,下外限最小值为Q1-3IQR
- 异常值:上线内限之间的为正常值,上下内限之外、外限之内的为中度异常值,默认用空心圆表示,上下外限之外的为极度异常值,默认用实心圆表示。
boxplot(x, notch=None, sym=None, vert=None, whis=None, positions=None, widths=None, patch_artist=None, bootstrap=None,
     usermedians=None, conf_intervals=None, meanline=None, showmeans=None, showcaps=None, showbox=None, showfliers=None,
     boxprops=None, labels=None, flierprops=None, medianprops=None, meanprops=None, capprops=None, whiskerprops=None,
     manage_ticks=True, autorange=False, zorder=None, *, data=None)
具体参数使用可参考:https://matplotlib.org/api/_as_gen/matplotlib.pyplot.boxplot.html


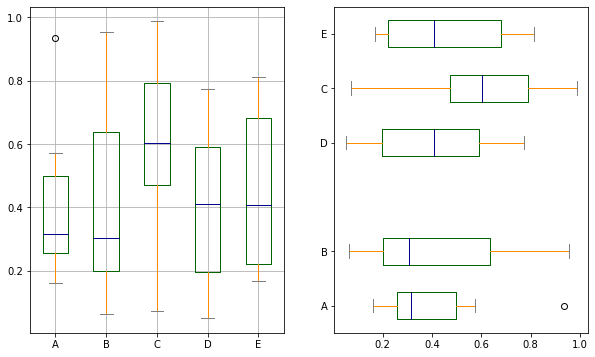
fig,axes = plt.subplots(1,2,figsize=(10,6))
df = pd.DataFrame(np.random.rand(10,5),columns=['A','B','C','D','E'])
color = dict(boxes = 'DarkGreen',whiskers = 'DarkOrange',medians = 'DarkBlue',caps = 'Gray')
df.plot.box(ax = axes[0],color = color,grid = True)
df.plot(kind='box',ax = axes[1],color = color,vert = False,positions = [1,2,5,4,6])#position表示五列分别位于y轴上1、2、5、4、6的位置上

figure = plt.figure(figsize=(10,6))
f = df.boxplot(vert = True, #是否垂直,默认为Truesym = 'o', #异常点形状,参考markerwhis = 1.5, #
           patch_artist = True, #上下四分位框内是否填充showmeans = True,  #是否显示均值meanline = False, #如果显示均值采用何种形状,True是虚线,False则为三角形showbox = True,  #是否显示箱线showcaps = True, #是否显示边缘线,即上内限和下内限showfliers = True, #是否显示异常值notch = False,  #中间箱体是否缺口
#            return_type = 'dict'  #返回类型为字典
          )
# plt.boxplot(df)  boxplot()另一种使用方法
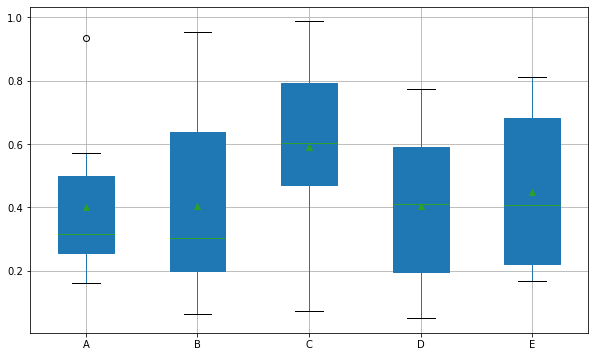
其中whis表示设置上、下内限时Q3-Q1的比例,默认为1.5,也可以设置一个区间例如[5,95]
df.boxplot()的执行结果默认返回一个<class 'matplotlib.axes._subplots.AxesSubplot'>,参数return_type = 'dict'表示返回一个字典,字典的key包括了boxes箱线、medians中位线、whiskers从box到上下内限的竖线、fliers异常值、caps上下内限的线、means均值线。设置返回字典是为了方便后续对图表进行显示设置,假设设置了返回类型为字典,后续对中位线操作for m in f['medians']:m.set(color='y',linewidth = 3),可在图表生成后调整整个图表的显示属性。
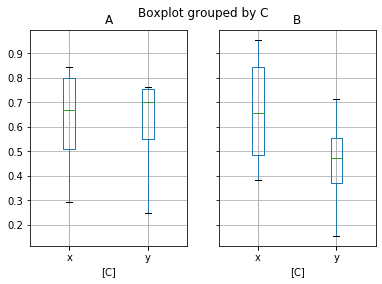
上述示例是对df的每一列分别进行了统计,箱线图也可以实现对列进行分组然后统计。


df = pd.DataFrame(np.random.rand(10,2),columns=['A','B'])
df['C'] = pd.Series(['x','x','y','x','x','y','y','y','x','x'])
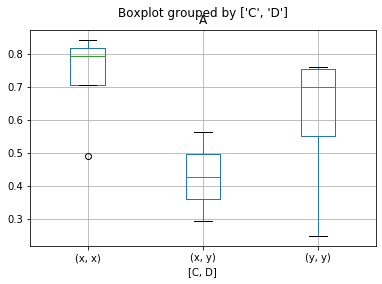
df['D'] = pd.Series(['x','y','y','x','x','y','y','y','x','y'])
f1 = df.boxplot(by = 'C',return_type = 'dict')  #按照C列分组然后统计,D列不为数值统计时忽略
f2 = df.boxplot(by = ['C','D'],column = 'A',return_type = 'dict') #按照C列和D列分组然后统计,只统计A列
官方教程参考:https://matplotlib.org/api/pyplot_api.html


)

)

)


...)

