如果可以实现记得点赞分享,谢谢老铁~
1.需求描述
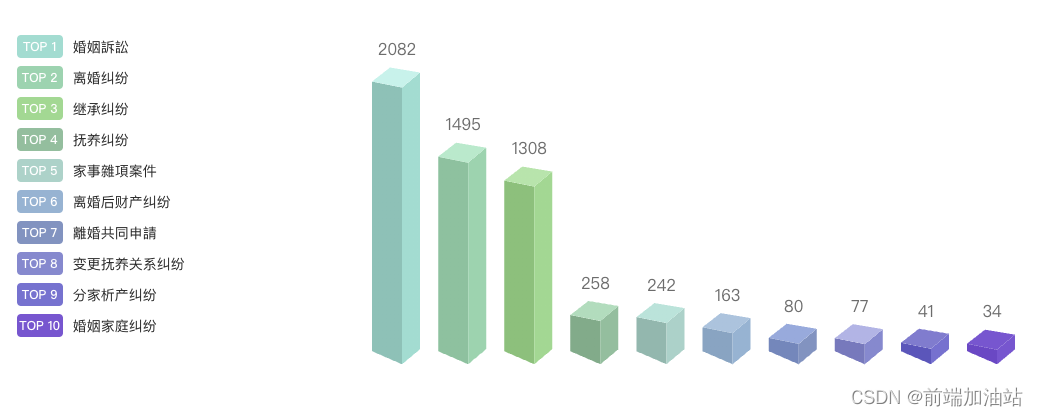
根据业务需求将不同的法律法规,展示不同的3d立体渐变柱状图。
2.先看下效果图

3. 确定三面的颜色,这里我是自定义的颜色
// 右面生成颜色const rightColorArr = ref(["#79DED1",...]);// 左面生成颜色const leftColorArr = ref(["#67C3B7", ...]);// 顶部生成颜色const topColorArr = ref(["#ADF4EB",...]);4.然后绘画三个面对应的函数,且注册
// 绘制左侧面const CubeLeft = echarts.graphic.extendShape({});// 绘制右侧面const CubeRight = echarts.graphic.extendShape({});// 绘制顶面const CubeTop = echarts.graphic.extendShape({});// 注册三个面图形echarts.graphic.registerShape("CubeLeft", CubeLeft);echarts.graphic.registerShape("CubeRight", CubeRight);echarts.graphic.registerShape("CubeTop", CubeTop);
5.重点在renderItem 自定义渲染函数上
series: [{type: "custom",renderItem: (params, api) => {let cubeLeftStyle: any = "";let cubeRightStyle: any = "";let cubeTopStyle: any = "";cubeLeftStyle = new echarts.graphic.LinearGradient(0, 0, 0, 1, [{offset: 0,color: leftColorArr.value[params.dataIndex],},{offset: 1,color: leftColorArr.value[params.dataIndex],},]);cubeRightStyle = new echarts.graphic.LinearGradient(0, 0, 0, 1, [{offset: 0,color: rightColorArr.value[params.dataIndex],},{offset: 1,color: rightColorArr.value[params.dataIndex],},]);cubeTopStyle = new echarts.graphic.LinearGradient(0, 0, 0, 1, [{offset: 0,color: topColorArr.value[params.dataIndex],},{offset: 1,color: topColorArr.value[params.dataIndex],},]);const location = api.coord([api.value(0), api.value(1)]);return {type: "group",children: [{type: "CubeLeft",shape: {api,xValue: api.value(0),yValue: api.value(1),x: location[0],y: location[1],xAxisPoint: api.coord([api.value(0), -80]),},style: {fill: cubeLeftStyle,},},{type: "CubeRight",shape: {api,xValue: api.value(0),yValue: api.value(1),x: location[0],y: location[1],xAxisPoint: api.coord([api.value(0), -80]),},style: {fill: cubeRightStyle,},},{type: "CubeTop",shape: {api,xValue: api.value(0),yValue: api.value(1),x: location[0],y: location[1],xAxisPoint: api.coord([api.value(0), -50]),},style: {fill: cubeTopStyle,},},],};},data: valList.value,},],
5.最后看全文吧,这个是vue3 的文件
<template><div class="topCon"><div class="tagList left"><div class="item" v-for="(item, index) in nameList" :key="index"><a-tag :color="rightColorArr[index]" class="tag">TOP {{ index + 1 }}</a-tag><span>{{ item }}</span></div></div><div class="right" id="AnalysisLegalTopBar" style="height: 400px"></div></div>
</template>
<script lang="ts">
import { onMounted, toRefs, ref, watch } from "vue";
import * as echarts from "echarts";
type EChartsOption = echarts.EChartsOption;
export default {props: {data: Array,},setup(props) {const { data } = toRefs<any>(props);const myChart = ref<any>(null);let valList = ref<any>([]);let nameList = ref<any>([]);// 右面生成颜色const rightColorArr = ref(["#79DED1","#75D5AF","#7FD991","#78BF9D","#95D3C9","#84B5D3","#7794C1","#828AD0","#7573D1","#8057D1",]);// 左面生成颜色const leftColorArr = ref(["#67C3B7","#68C39F","#68C27A","#65AD8A","#7BB8AE","#76A6C3","#6789BC","#737ABE","#5A58BC","#7349C6",]);// 顶部生成颜色const topColorArr = ref(["#ADF4EB","#9BEBCC","#9DE6AB","#98DEBD","#A1E5DA","#9DC5DE","#8CACDD","#B0B5E6","#7F7DD0","#8057D1",]);// 绘制左侧面const CubeLeft = echarts.graphic.extendShape({shape: {x: 0,y: 0,},buildPath: function (ctx: any, shape) {// 会canvas的应该都能看得懂,shape是从custom传入的const xAxisPoint = shape.xAxisPoint;const c0 = [shape.x + 7, shape.y];const c1 = [shape.x - 23, shape.y - 6];const c2 = [xAxisPoint[0] - 23, xAxisPoint[1] - 13];const c3 = [xAxisPoint[0] + 7, xAxisPoint[1]];ctx.moveTo(c0[0], c0[1]).lineTo(c1[0], c1[1]).lineTo(c2[0], c2[1]).lineTo(c3[0], c3[1]).closePath();},});// 绘制右侧面const CubeRight = echarts.graphic.extendShape({shape: {x: 0,y: 0,},buildPath: function (ctx: any, shape) {const xAxisPoint = shape.xAxisPoint;const c1 = [shape.x + 7, shape.y];const c2 = [xAxisPoint[0] + 7, xAxisPoint[1]];const c3 = [xAxisPoint[0] + 25, xAxisPoint[1] - 15];const c4 = [shape.x + 25, shape.y - 15];ctx.moveTo(c1[0], c1[1]).lineTo(c2[0], c2[1]).lineTo(c3[0], c3[1]).lineTo(c4[0], c4[1]).closePath();},});// 绘制顶面const CubeTop = echarts.graphic.extendShape({shape: {x: 0,y: 0,},buildPath: function (ctx: any, shape) {const c1 = [shape.x + 7, shape.y];const c2 = [shape.x + 25, shape.y - 15]; //右点const c3 = [shape.x - 5, shape.y - 20];const c4 = [shape.x - 23, shape.y - 6];ctx.moveTo(c1[0], c1[1]).lineTo(c2[0], c2[1]).lineTo(c3[0], c3[1]).lineTo(c4[0], c4[1]).closePath();},});// 注册三个面图形echarts.graphic.registerShape("CubeLeft", CubeLeft);echarts.graphic.registerShape("CubeRight", CubeRight);echarts.graphic.registerShape("CubeTop", CubeTop);const getOption = () => {return {backgroundColor: "transparent",title: {// text: "单位:个",textStyle: {color: "#79DED1",fontWeight: "800",fontSize: 16,},left: "18px",top: "1%",},tooltip: {trigger: "axis",axisPointer: {type: "shadow",},formatter: function (params, ticket, callback) {const item = params[1];return item.name + " : " + item.value;},},grid: {top: "12%",bottom: "3%",left: "left",containLabel: true,},xAxis: {type: "category",show: false,data: nameList.value,axisLine: {show: true,lineStyle: {color: "#7ebaf2",},},axisTick: {show: false,length: 9,alignWithLabel: true,lineStyle: {color: "#7DFFFD",},},axisLabel: {fontSize: 12,},},yAxis: {type: "value",show: false,min: 0,axisLine: {show: true,lineStyle: {color: "#7ebaf2",},},splitLine: {show: false,},splitArea: {show: true,areaStyle: {color: ["rgba(26,50,83,1)", "rgba(30,57,92,1)"],},},axisTick: {show: false,},axisLabel: {fontSize: 12,},boundaryGap: ["20%", "20%"],},series: [{type: "custom",renderItem: (params, api) => {let cubeLeftStyle: any = "";let cubeRightStyle: any = "";let cubeTopStyle: any = "";cubeLeftStyle = new echarts.graphic.LinearGradient(0, 0, 0, 1, [{offset: 0,color: leftColorArr.value[params.dataIndex],},{offset: 1,color: leftColorArr.value[params.dataIndex],},]);cubeRightStyle = new echarts.graphic.LinearGradient(0, 0, 0, 1, [{offset: 0,color: rightColorArr.value[params.dataIndex],},{offset: 1,color: rightColorArr.value[params.dataIndex],},]);cubeTopStyle = new echarts.graphic.LinearGradient(0, 0, 0, 1, [{offset: 0,color: topColorArr.value[params.dataIndex],},{offset: 1,color: topColorArr.value[params.dataIndex],},]);const location = api.coord([api.value(0), api.value(1)]);return {type: "group",children: [{type: "CubeLeft",shape: {api,xValue: api.value(0),yValue: api.value(1),x: location[0],y: location[1],xAxisPoint: api.coord([api.value(0), -80]),},style: {fill: cubeLeftStyle,},},{type: "CubeRight",shape: {api,xValue: api.value(0),yValue: api.value(1),x: location[0],y: location[1],xAxisPoint: api.coord([api.value(0), -80]),},style: {fill: cubeRightStyle,},},{type: "CubeTop",shape: {api,xValue: api.value(0),yValue: api.value(1),x: location[0],y: location[1],xAxisPoint: api.coord([api.value(0), -50]),},style: {fill: cubeTopStyle,},},],};},data: valList.value,},{type: "bar",label: {normal: {show: true,position: "top",fontSize: 16,color: "#6C6C6C",offset: [2, -25],},},itemStyle: {color: "transparent",},tooltip: {},data: valList.value,},],};};watch(() => data.value,(list) => {let option_bar: any = getOption();list.forEach((item, index) => {nameList.value.push(item.name);valList.value.push(item.value);});option_bar && myChart.value.setOption(option_bar);});onMounted(() => {// 基于准备好的dom,初始化echarts实例var chartDom: any = document.getElementById("AnalysisLegalTopBar");myChart.value = echarts.init(chartDom);window.addEventListener("resize", () => {myChart.value.resize();});});return {nameList,rightColorArr,};},
};
</script>
<style lang="less" scoped>
.topCon {display: flex;justify-content: center;align-items: center;.left {width: 30%;.item {display: flex;align-items: center;}}.right {width: 70%;}.tagList {.tag {width: 46px;height: 23px;border-radius: 4px;font-size: 10px;font-weight: 500;line-height: 20px;margin: 4px 0px;margin-right: 10px;color: #fff;background: rgba(121, 222, 209, 0.39);display: flex;justify-content: center;align-items: center;}}
}
</style>


:文章页码设置)


