文章目录
- 1. 生成拟合数据集
- 2. 构建线性回归模型数据流图
- 3. 在Session中运行已构建的数据流图
- 4. 输出拟合的线性回归模型
- 5. TensorBoard神经网络数据流图可视化
- 6. 完整代码
本文讲解:
以一元线性回归模型为例,
- 介绍如何使用TensorFlow 搭建模型 并通过会话与后台建立联系,并通过数据来训练模型,求解参数, 直到达到预期结果为止。
- 学习如何使用TensorBoard可视化工具来展示网络图、张量的指标变化、张量的分布情况等。
设给定一批由 y=3x+2生成的数据集( x ,y ),建立线性回归模型h(x)= wx + b ,预测出 w=3 和 b=2。
1. 生成拟合数据集
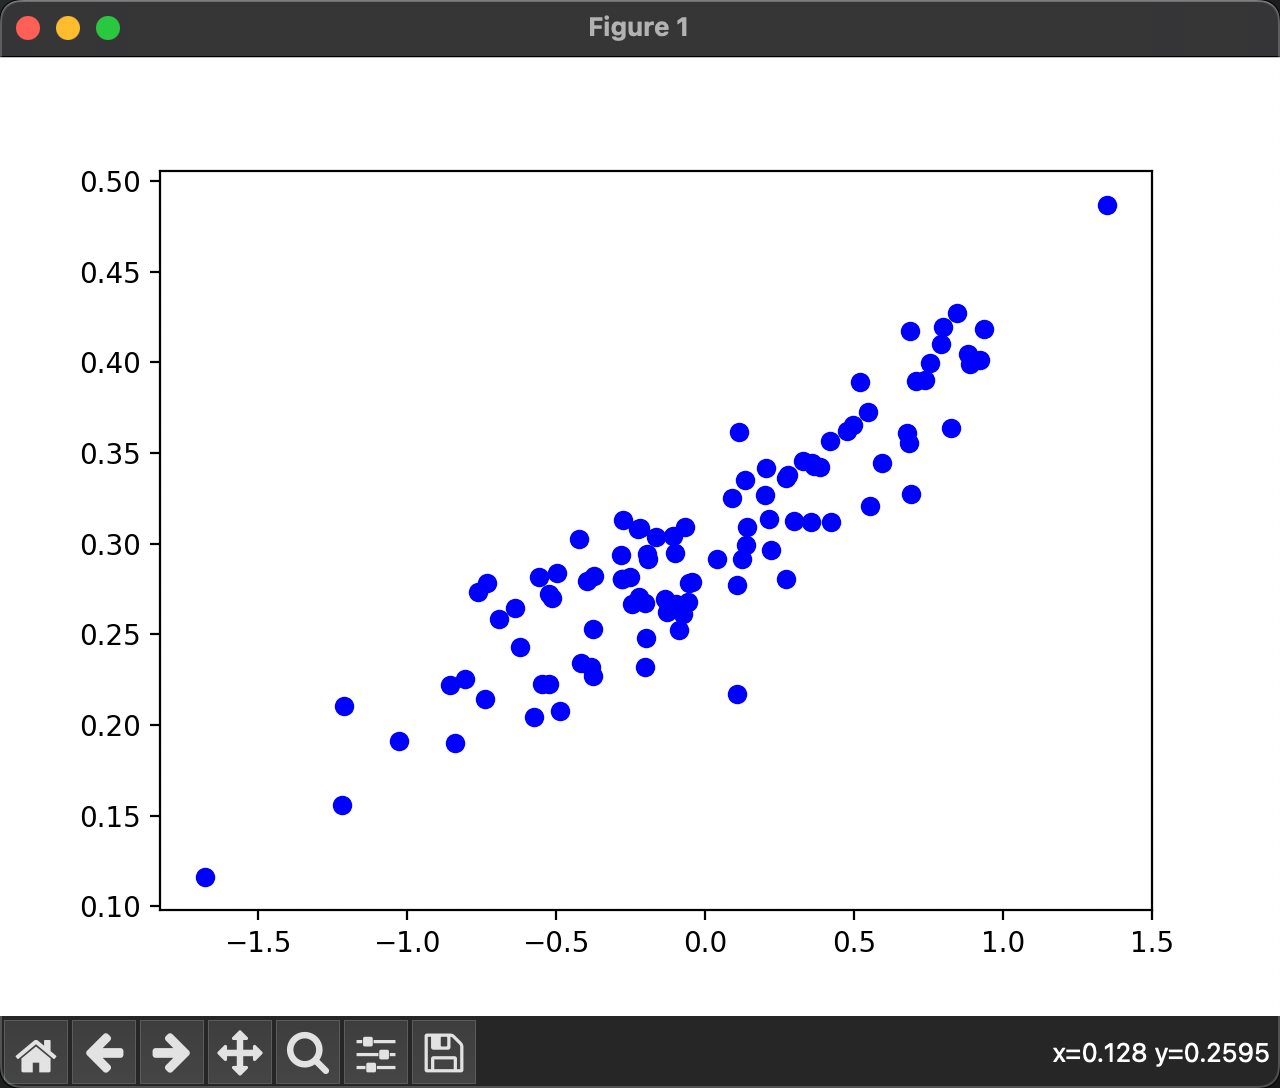
数据集只含有一个特征向量,注意误差项需要满足高斯分布(正态分布),程序使用了NumPy和Matplotlib库。
- NumPy是Python的一个开源数值科学计算库,可用来存储和处理大型矩阵。
- Matplotlib是Python的绘图库,它可与NumPy一起使用,提供了一种有效的MATLAB开源替代方案。
其代码如下:
# 首先导入3个库
import numpy as np
import tensorflow as tf
import matplotlib.pyplot as plt# 随机产生100个数据点,随机概率符合高斯分布(正态分布)
num_points = 100
vectors_set = []
for i in range(num_points):# Draw random samples from a normal (Gaussian) distribution.x1 = np.random.normal(0., 0.55)y1 = x1 * 0.1 + 0.3 + np.random.normal(0.0, 0.03)# 坐标点vectors_set.append([x1, y1])
# 定义特征向量x
x_data = [v[0] for v in vectors_set]
# 定义标签向量y
y_data = [v[1] for v in vectors_set]# 按[x_data,y_data]在X-Y坐标系中以打点方式显示,调用plt建立坐标系并将值输出
plt.scatter(x_data, y_data, c='b')
plt.show()
2. 构建线性回归模型数据流图
# 利用TensorFlow随机产生w和b,为了图形显示需要,分别定义名称 myw 和 myb
w = tf.Variable(tf.compat.v1.random_uniform([1], -1., 1.), name='myw')
b = tf.Variable(tf.zeros([1]), name='myb')
# 根据随机产生的w和b,结合上面随机产生的特征向量x_data,经过计算得出预估值
y = w * x_data + b
# 以预估值y和实际值y_data之间的均方差作为损失
loss = tf.reduce_mean(tf.square(y - y_data, name='mysquare'), name='myloss')
# 采用梯度下降法来优化参数
optimizer = tf.compat.v1.train.GradientDescentOptimizer(0.5)
train = optimizer.minimize(loss, name='mytrain')
3. 在Session中运行已构建的数据流图
# global_variables_initializer初始化Variable等变量
sess = tf.compat.v1.Session()
init = tf.compat.v1.global_variables_initializer()
sess.run(init)
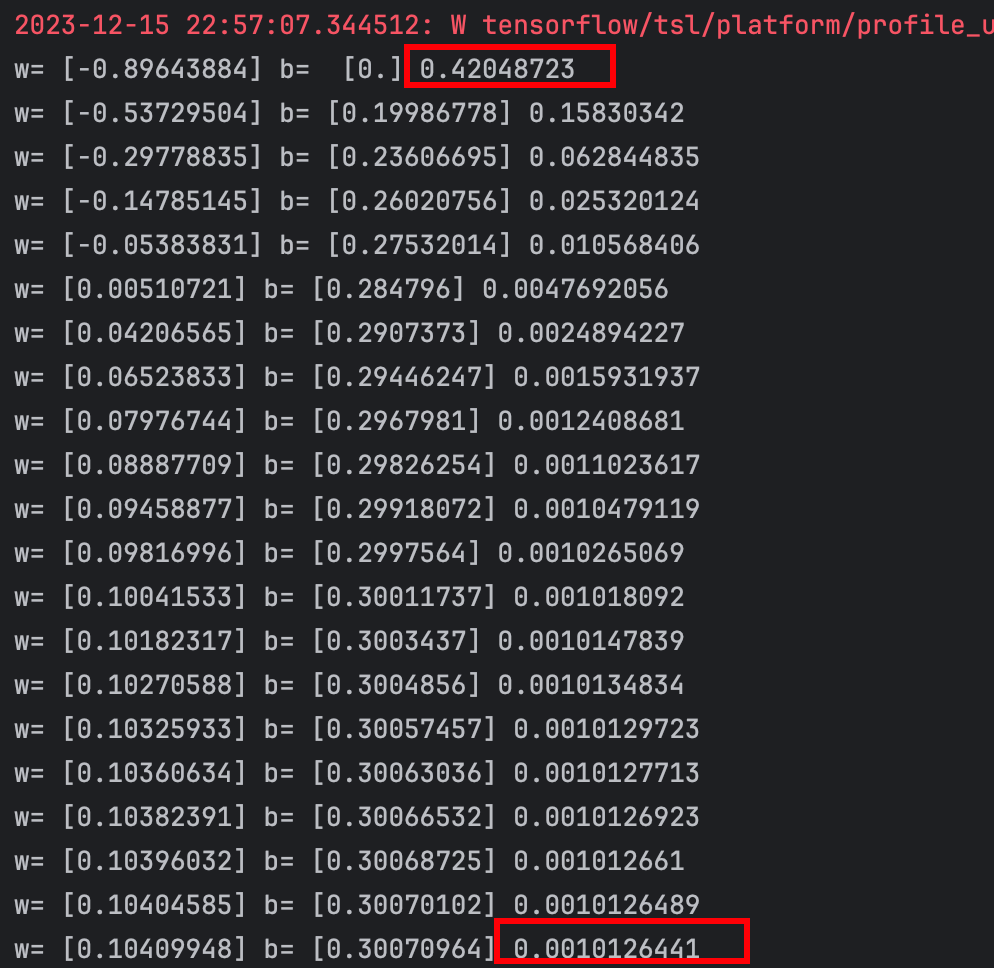
print("w=", sess.run(w), "b= ", sess.run(b), sess.run(loss))
# 迭代20次train
for step in range(20):sess.run(train)print("w=", sess.run(w), "b=", sess.run(b), sess.run(loss))
输出w和b,损失值的变化情况,可以看到损失值从0.42降到了0.001。当然每次拟合的结果都不一致。

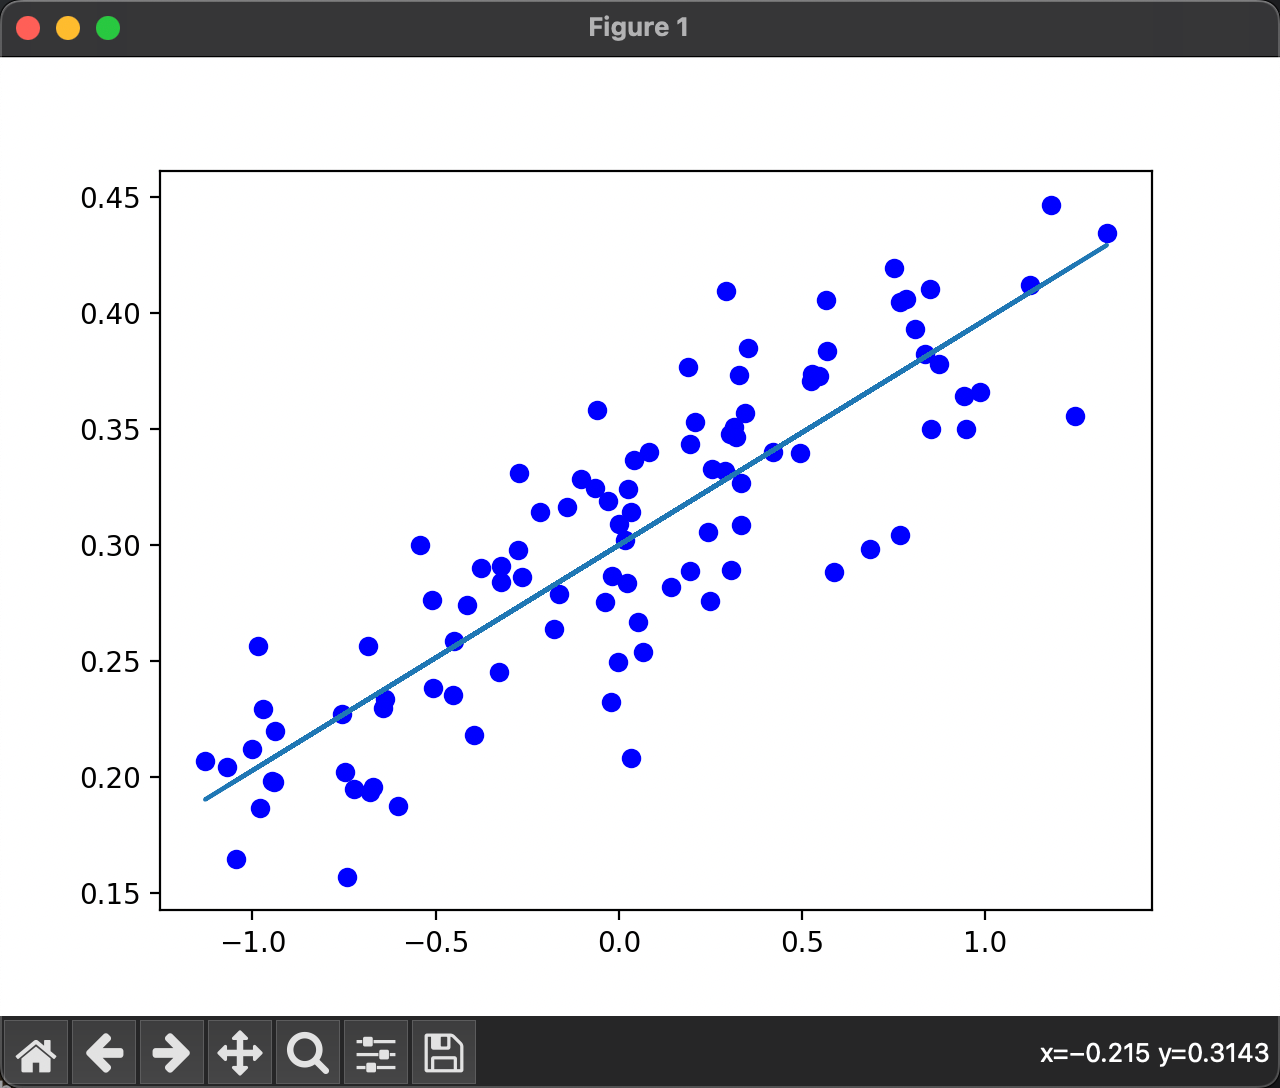
4. 输出拟合的线性回归模型
plt.scatter(x_data, y_data, c='b')
plt.plot(x_data, sess.run(w) * x_data + sess.run(b))
plt.show()

5. TensorBoard神经网络数据流图可视化
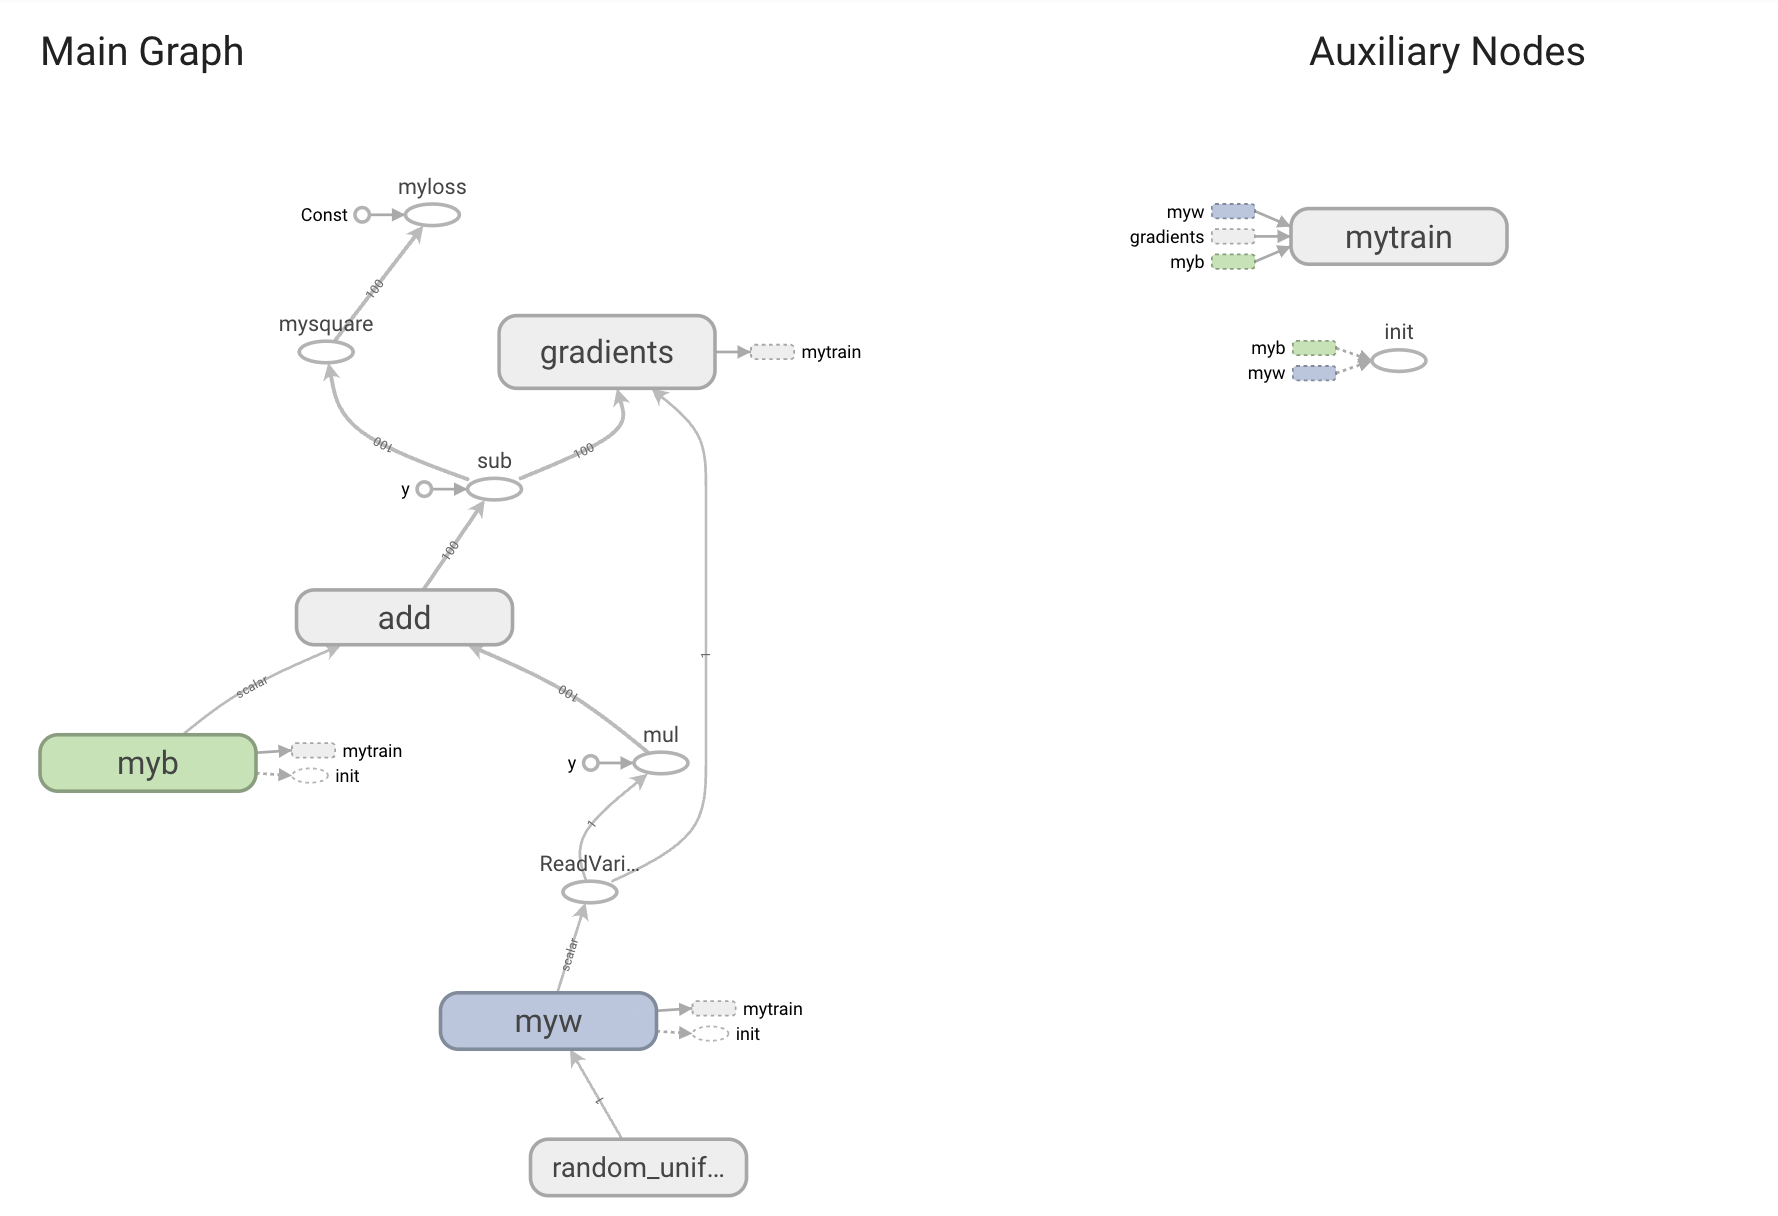
TensorBoard 是 TensorFlow 的可视化工具包 , 使用者通过TensorBoard可以将代码实现的数据流图以可视化的图形显示在浏览器中,这样方便使用者编写和调试TensorFlow数据流图程序。
首先,将数据流图写入到文件中
# 写入磁盘,以供TensorBoard在浏览器中展示
writer = tf.compat.v1.summary.FileWriter("./mytmp", sess.graph)
运行该代码后就可以将整个神经网络节点信息写入./mytmp目录下。
打开终端,执行如下命令
tensorboard --logdir=./tensflow-demo/mytmpServing TensorBoard on localhost; to expose to the network, use a proxy or pass --bind_all
TensorBoard 2.15.1 at http://localhost:6007/ (Press CTRL+C to quit)
访问 http://localhost:6007/,如下图生成的神经网络数据流图

通过添加参数--bind_all 将图暴露给网络。
6. 完整代码
# 首先导入3个库
import numpy as np
import tensorflow as tf
import matplotlib.pyplot as plt# 随机产生100个数据点,随机概率符合高斯分布(正态分布)
num_points = 100
vectors_set = []
for i in range(num_points):# Draw random samples from a normal (Gaussian) distribution.x1 = np.random.normal(0., 0.55)y1 = x1 * 0.1 + 0.3 + np.random.normal(0.0, 0.03)# 坐标点vectors_set.append([x1, y1])
# 定义特征向量x
x_data = [v[0] for v in vectors_set]
# 定义标签向量y
y_data = [v[1] for v in vectors_set]# 按[x_data,y_data]在X-Y坐标系中以打点方式显示,调用plt建立坐标系并将值输出
# plt.scatter(x_data, y_data, c='b')
# plt.show()tf.compat.v1.disable_v2_behavior()# 利用TensorFlow随机产生w和b,为了图形显示需要,分别定义名称myw 和 myb
w = tf.Variable(tf.compat.v1.random_uniform([1], -1., 1.), name='myw')
b = tf.Variable(tf.zeros([1]), name='myb')
# 根据随机产生的w和b,结合上面随机产生的特征向量x_data,经过计算得出预估值
y = w * x_data + b
# 以预估值y和实际值y_data之间的均方差作为损失
loss = tf.reduce_mean(tf.square(y - y_data, name='mysquare'), name='myloss')
# 采用梯度下降法来优化参数
optimizer = tf.compat.v1.train.GradientDescentOptimizer(0.5)
train = optimizer.minimize(loss, name='mytrain')# global_variables_initializer初始化Variable等变量
sess = tf.compat.v1.Session()
init = tf.compat.v1.global_variables_initializer()
sess.run(init)
print("w=", sess.run(w), "b= ", sess.run(b), sess.run(loss))
# 迭代20次train
for step in range(20):sess.run(train)print("w=", sess.run(w), "b=", sess.run(b), sess.run(loss))# 写入磁盘,供TensorBoard在浏览器中展示
# writer = tf.compat.v1.summary.FileWriter("./mytmp", sess.graph)
#
plt.scatter(x_data, y_data, c='b')
plt.plot(x_data, sess.run(w) * x_data + sess.run(b))
plt.show()因为运行的是TensorFlow 1.x 系统运行的是 TensorFlow 2.x.,所以运行过程中有两个问题:
1.没有Session
在 TF2 中可以通过 tf.compat.v1.Session() 访问会话
2.loss passed to Optimizer.compute_gradients should be a function when eager execution is enabled
在代码前面添加如下代码,屏蔽v2的行为
tf.compat.v1.disable_v2_behavior()


)


)


