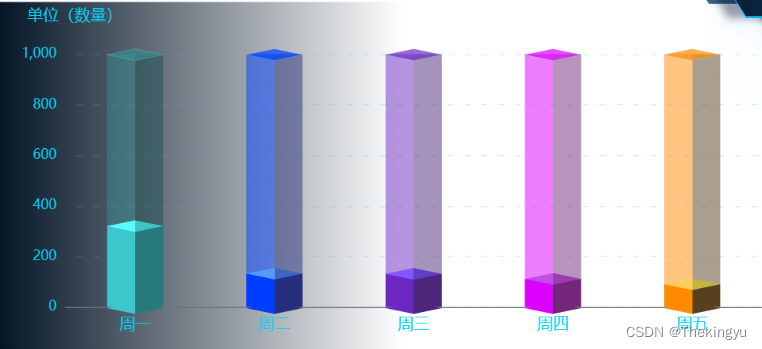
根据一个博主代码改编而来
<template><div class="indexBox"><div id="chart"></div></div>
</template><script  setup>
import * as echarts from "echarts";
import { onMounted } from "vue";
import imgsss from "@/assets/imgs/111.png";onMounted(() => {create();
});const colorArr = (arrList, type) => {let returnList = [];if (type == 1) {arrList.forEach((item) => {let info = {value: item.val,itemStyle: {normal: {borderColor: "#89e3ec",borderWidth: 2,color: item.starColor,},},};returnList.push(info);});} else {arrList.forEach((item) => {let infor = {value: item.val,itemStyle: {color: {// https://echarts.apache.org/zh/option.html#color//疑似根据整个demo尺寸,定位图片未知//   image: imgsss, // 支持为 HTMLImageElement, HTMLCanvasElement,不支持路径字符串//   repeat: 'repeat' // 是否平铺,可以是 'repeat-x', 'repeat-y', 'no-repeat'type: "linear",x: 0,x2: 1,y: 0,y2: 0,//给菱形上色colorStops: [{offset: 0,color: item.starColor,},{offset: 0.5,color: item.starColor,},{offset: 0.5,color: item.endColor,},{offset: 1,color: item.endColor,},],},},};returnList.push(infor);});}return returnList;
};function create() {var chartDom = document.getElementById("chart");var myChart = echarts.init(chartDom);var xData = ["周一", "周二", "周三", "周四", "周五"];// 完成数据数组var completeData = [320, 132, 101, 11, 90];var barWidth = 50;var showData = [];var otherData = [];let completeDataList = [{ val: 320, starColor: "#3dc6cc", endColor: "#267A7B" },{ val: 132, starColor: "#003EFF", endColor: "#262F7B" },{ val: 131, starColor: "#6C29C1", endColor: "#4B267B" },{ val: 111, starColor: "#DB00FF", endColor: "#74267B" },{ val: 90, starColor: "#FF8A00", endColor: "#56401F" },];completeData = colorArr(completeDataList);let otherDataList = [{val: 680,starColor: "rgba(53, 140, 144,0.5)",endColor: "rgba(31, 82, 86,0.5)",},{val: 868,starColor: "rgba(0, 62, 255,0.5)",endColor: "rgba(38, 47, 123,0.5)",},{val: 869,starColor: "rgba(108, 41, 193,0.5)",endColor: "rgba(75, 38, 123,0.5)",},{val: 889,starColor: "rgba(219, 0, 255,0.5)",endColor: "rgba(116, 38, 123,0.5)",},{val: 910,starColor: "rgba(255, 138, 0,0.5)",endColor: "rgba(86, 64, 31,0.5)",},];otherData = colorArr(otherDataList);//  中间菱形let constDatasList = [{ val: 320, starColor: "#56fdfd", endColor: "#3fc3c3" },{ val: 132, starColor: "#5699fd", endColor: "#3f64c3" },{ val: 131, starColor: "#8156fd", endColor: "#613fc3" },{ val: 111, starColor: "#c24fe5", endColor: "#9c3bb2" },{ val: 90, starColor: "#Fdce56", endColor: "#c3b63f" },];let constDatas = colorArr(constDatasList);let showDataList = [{val: 1000,starColor: "rgba(53, 140, 144,0.7)",endColor: "rgba(31, 82, 86,0.5)",},{val: 1000,starColor: "rgba(0, 62, 255,0.7)",endColor: "rgba(38, 47, 123,0.5)",},{val: 1000,starColor: "rgba(108, 41, 193,0.7)",endColor: "rgba(75, 38, 123,0.5)",},{val: 1000,starColor: "rgba(219, 0, 255,0.7)",endColor: "rgba(116, 38, 123,0.5)",},{val: 1000,starColor: "rgba(255, 138, 0,0.7)",endColor: "rgba(86, 64, 31,0.5)",},];showData = colorArr(showDataList, 1);var option = {//调整光标移入,展示数据的样式tooltip: {trigger: "axis",// formatter: function (params) {//   return (//     params[0].axisValue +//     ":" +//     "<br/>计划:" +//     planData[params[0].dataIndex] +//     "<br/>完成:" +//     completeData[params[0].dataIndex]//   );// },},title: {text: "单位(数量)",left: "3%",textStyle: {color: "#07D1FA",fontWeight: "normal",fontSize: 14,},},//调整图例legend: {data: ["计划", "完成"],show: false,},//调整图表距边框的距离grid: {left: "3%",right: "3%",top: "15%",bottom: "5%",containLabel: true,},// 调整图像x轴xAxis: {data: xData,axisTick: {show: false,},axisLabel: {textStyle: {fontFamily: "Microsoft YaHei",color: "#07D1FA",fontWeight: "400",fontSize: "14",},},},//调整图像y轴yAxis: {axisTick: {show: false,},axisLine: {show: false,},axisLabel: {color: "#07D1FA",// show: false,},splitLine: {show: true,lineStyle: {type: [5, 10],dashOffset: 5,color: "#07D1FA",width: 1,opacity: 0.21,},},},//图像的关键显示部分,此处5个拼接一个堆叠柱子,注意此处的调整series: [{z: 1,name: "计划",type: "bar",stack: "1",barWidth: barWidth,// stack: "总量",// color: color[0],data: completeData,},{z: 2,name: "完成",type: "bar",stack: "1",barWidth: barWidth,// stack: "总量",// color: color[1],data: otherData,},//柱形底部{z: 3,name: "项目",type: "pictorialBar",data: completeData,symbol: "diamond",symbolOffset: ["0%", "60%"],symbolSize: [barWidth, 10],// itemStyle: {//   normal: {//     color: function (params) {//       let arr = ["#3dc6cc", "#003EFF", "#6C29C1", "#DB00FF", "#FF8A00"];//       console.log(arr[params.dataIndex]);//       let ass = arr[params.dataIndex];//       if (params.dataIndex == 0) {//         return "#DB00FF";//       }//       if (params.dataIndex == 1) {//         return "#003EFF";//       }//     },//   },// },tooltip: {show: false,},},{z: 3,name: "1",type: "pictorialBar",data: constDatas,symbol: "diamond",symbolPosition: "end",symbolOffset: ["0%", "-50%"],symbolSize: [barWidth, 10],},{z: 5,name: "项目",type: "pictorialBar",symbolPosition: "end",data: showData,symbol: "diamond",symbolOffset: ["0%", "-50%"],symbolSize: [barWidth, (10 * barWidth) / barWidth],tooltip: {show: false,},// itemStyle: {//   normal: {//     label: {//       formatter: "{c}",//       show: true,//       position: "top",//       textStyle: {//         fontWeight: 400,//         fontSize: "13",//         color: "#F2F7FA",//         lineHeight: 20,//       },//     },//   },// },},],};option && myChart.setOption(option);
}
</script><style scoped lang="scss">
.indexLeft {width: 360px;height: 1016px;margin-top: 64px;background: linear-gradient(90deg,#031425 0%,rgba(3, 20, 37, 0.5) 50%,rgba(3, 20, 37, 0) 100%);
}#chart {width: 700px;height: 300px;
}
</style>)


)
鲜花的识别)
 python操作redis)


