参考了python cartopy手动导入地图数据绘制底图/python地图上绘制散点图:Downloading:warnings/散点图添加图里标签_python add_feature-CSDN博客
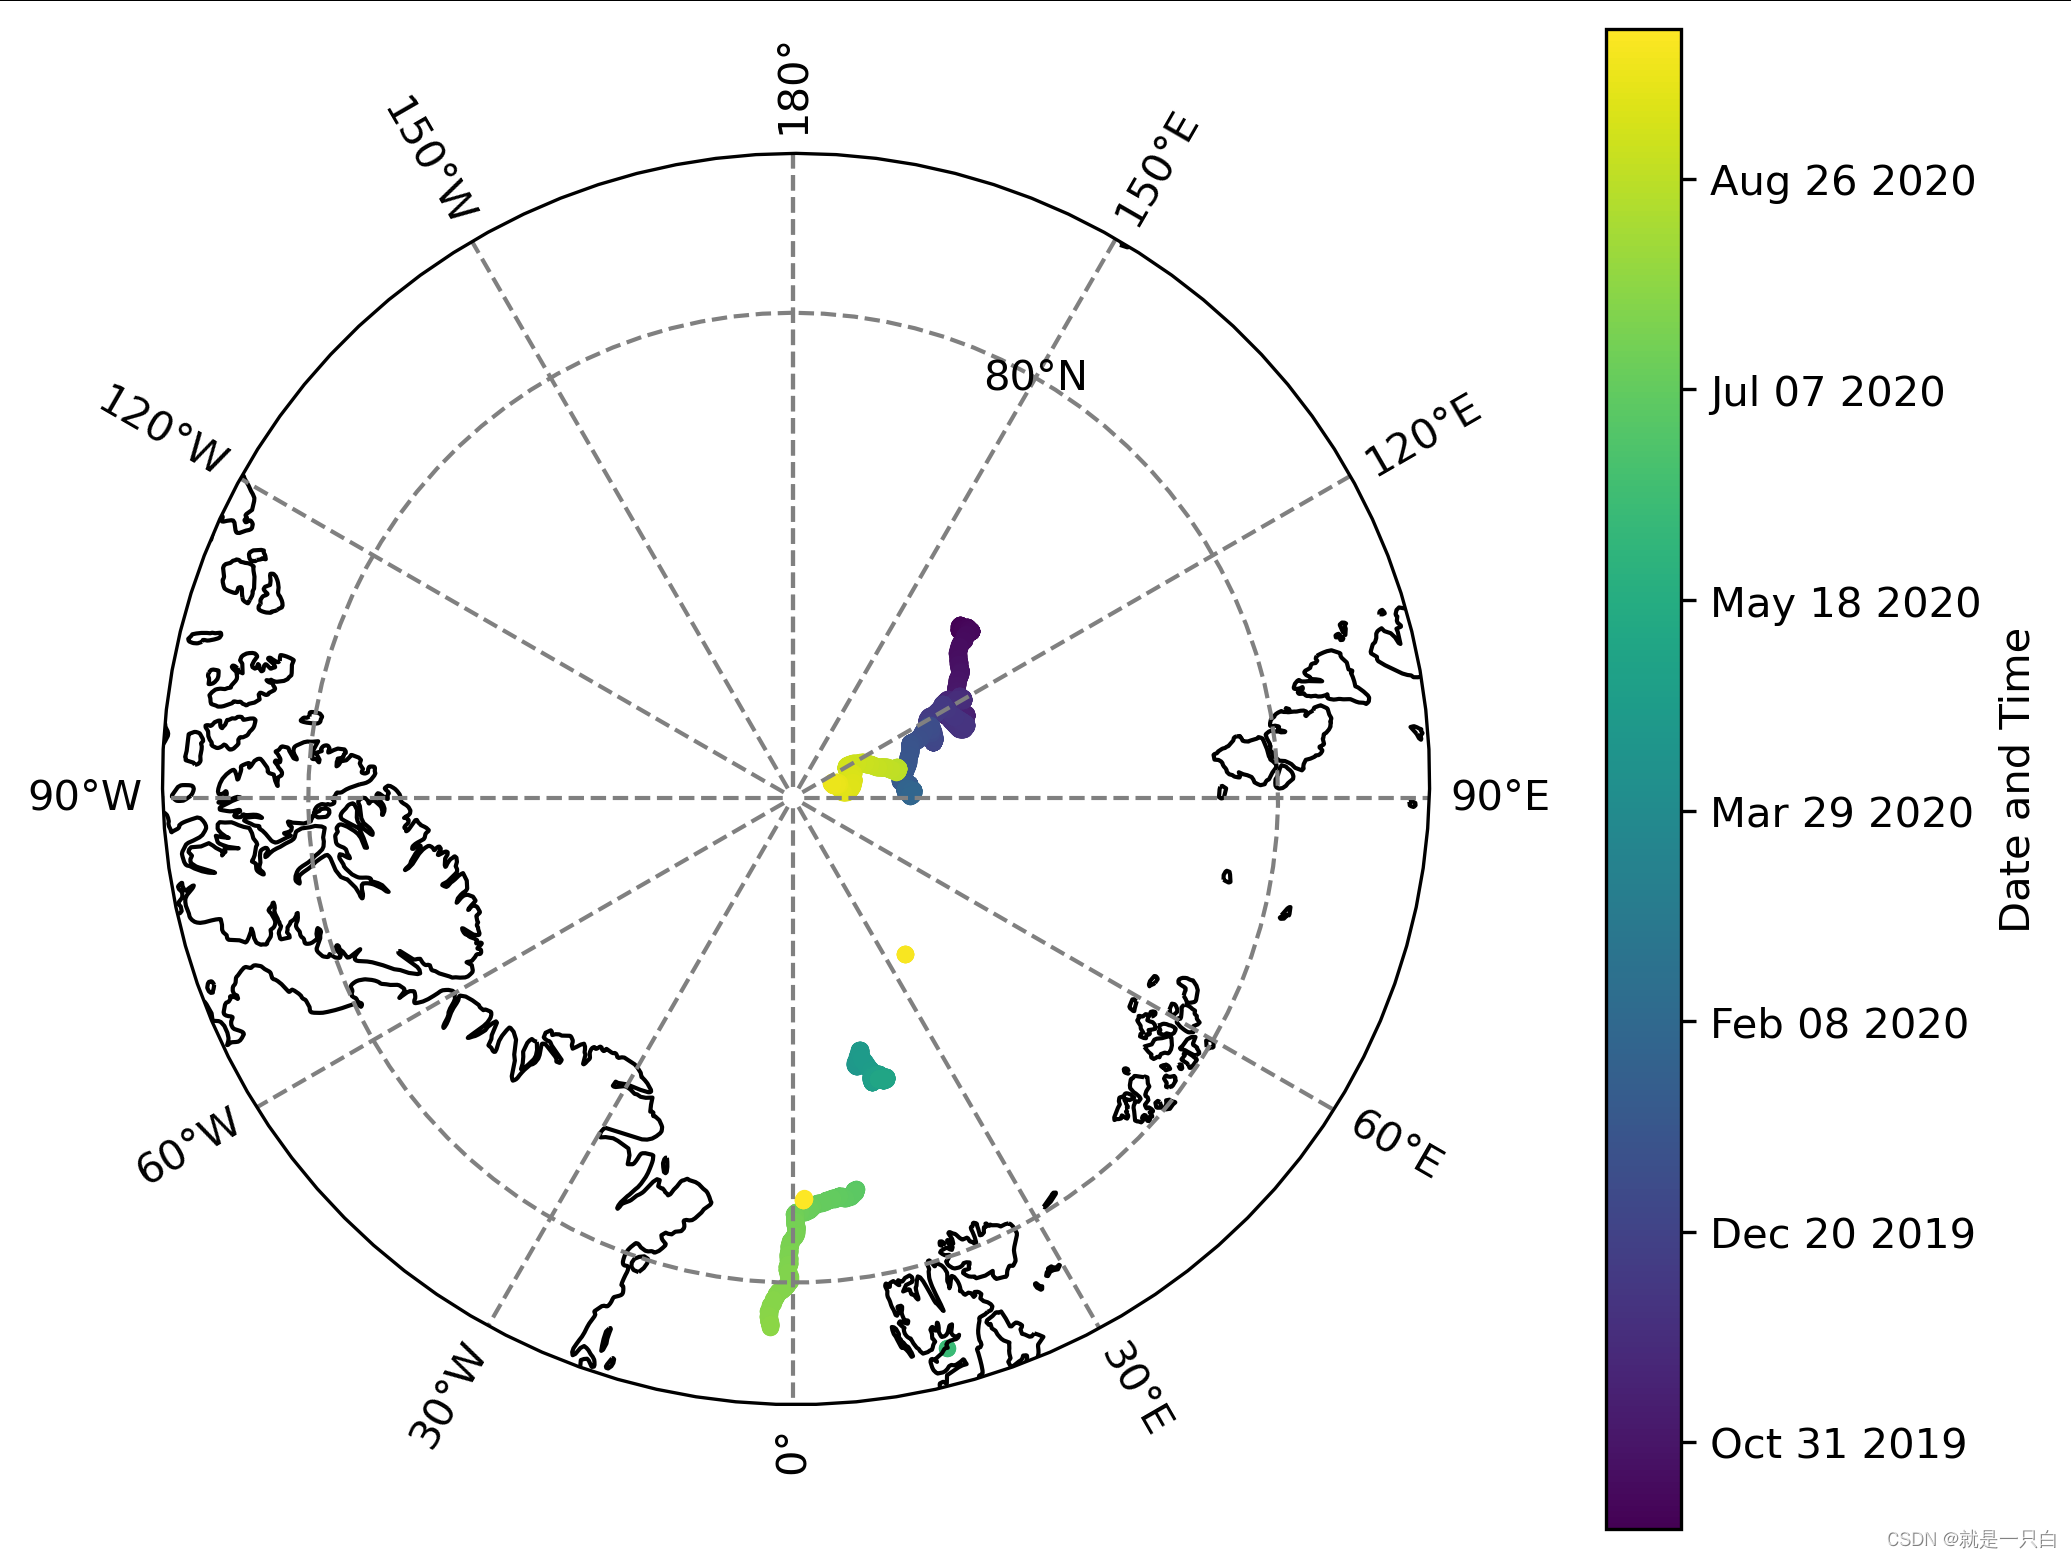
点的颜色按照时间显示

# -*- coding: utf-8 -*-
"""
Created on Mon Nov 13 11:32:48 2023"""import numpy as np
import cartopy.crs as ccrs
import matplotlib.pyplot as plt
import matplotlib.patches as mpatches
import cartopy.feature as cfeature
import matplotlib.ticker as mticker
import matplotlib.path as mpath
import pandas as pd
from matplotlib.dates import date2num, DateFormatter
import matplotlib.dates as mdatesfrom matplotlib.colors import Normalize# 转换时间格式r'C:\Users\Desktop\csv\all_files1min_nan.csv'
df = pd.read_csv(r'C:\Users\Desktop\csv\all_files_nan.csv')df['time'] = pd.to_datetime(df['time'])# 设置时间列为索引
df.set_index('time', inplace=True)# 按小时计算平均值
df = df.resample('H').mean()# 取消索引
df = df.reset_index()
df.dropna(axis=0, inplace=True)fig = plt.figure(figsize=(12, 10),dpi=300)
proj =ccrs.NorthPolarStereo(central_longitude=0)#设置地图投影
#在圆柱投影中proj = ccrs.PlateCarree(central_longitude=xx)
leftlon, rightlon, lowerlat, upperlat = (-180,180,75,90)#经纬度范围img_extent = [leftlon, rightlon, lowerlat, upperlat]f1_ax1 = fig.add_axes([0.2, 0.3, 0.5, 0.5],projection = ccrs.NorthPolarStereo(central_longitude=0))#绘制地图位置f1_ax1.set_extent(img_extent, ccrs.PlateCarree())
# f1_ax1.add_feature(cfeature.COASTLINE)
# f1_ax1.add_feature(cfeature.OCEAN)
# f1_ax1.add_feature(cfeature.LAND)
# 添加网格线和海岸线
# f1_ax1.gridlines(draw_labels=True)
f1_ax1.coastlines()
g1=f1_ax1.gridlines(crs=ccrs.PlateCarree(), draw_labels=True, linewidth=1, color='gray',linestyle='--')
g1.xlocator = mticker.FixedLocator(np.linspace(-180,180,13))
g1.ylocator = mticker.FixedLocator(np.linspace(60, 90,4))theta = np.linspace(0, 2*np.pi, 100)
center, radius = [0.5, 0.5], 0.44
verts = np.vstack([np.sin(theta), np.cos(theta)]).T
circle = mpath.Path(verts * radius + center)
f1_ax1.set_boundary(circle, transform=f1_ax1.transAxes)# 绘制极投影图
# plt.figure(figsize=(8, 8))# 遍历DataFrame的行
for index, row in df.iterrows():# 将时间转换为数值time_value = date2num(row['time'])# 绘制散点,颜色按时间sc=f1_ax1.scatter(row['lon'], row['lat'], c=time_value, cmap='viridis', s=10,vmin=date2num(df['time']).min(), vmax=date2num(df['time']).max(),transform=ccrs.Geodetic())# 添加colorbar
# 添加colorbar
cbar = plt.colorbar(sc, label='Date and Time')
# 将colorbar上的标签显示为日期和时间
date_format = mdates.DateFormatter('%b %d %Y')
# %H:%M:%S
cbar.ax.yaxis.set_major_formatter(date_format)
# cbar.set_ticklabels(df['time'])
# 自定义日期格式化器plt.show()


-Python快速开发网页应用)


)
