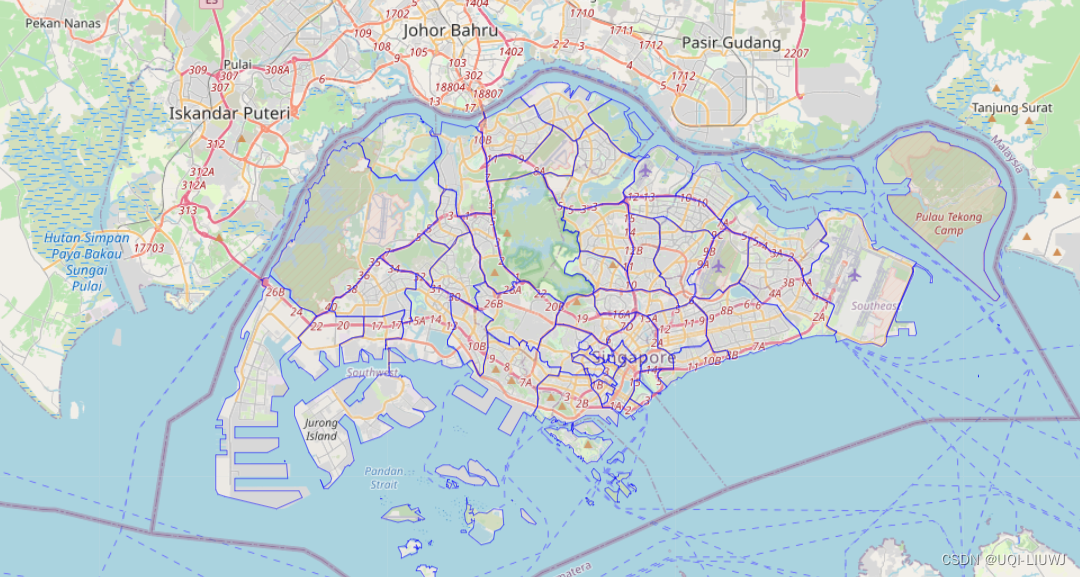
0 效果图

点开某一个区域后,内容是这个区域的用地类型分布

1 读取数据
import folium
import matplotlib.pyplot as plt
import re
import geopandas as gpd
subzone=gpd.read_file('MasterPlan2019PlanningAreaBoundaryNoSea.geojson')
subzone
2 提取subzone 信息
对description列进行正则表达式操作,提取subzone信息
def extract_name_from_description(description):match = re.search(r"<th>PLN_AREA_N</th> <td>(.*?)</td>", description)#使用正则表达式查找subzone的名字#查找的是' <th>PLN_AREA_N</th> <td>BUKIT BATOK</td>'这一部分内容#BUKIT BATOK 是第一个groupreturn match.group(1) if match else None#返回对应的subzone的名字subzone['subzone_name']=subzone['Description'].apply(extract_name_from_description)
subzone=subzone[['subzone_name','geometry']]
subzone
3 找到地图的中心点,并绘制subzone图
center_sg=subzone.geometry.unary_union.centroid
print(center_sg)
#POINT (103.82073869660411 1.3524404921177333)m = folium.Map(location=(list(center_sg.coords)[0][1],list(center_sg.coords)[0][0]), zoom_start=11)
#绘制地图folium.GeoJson(subzone,style_function=lambda x: {"fillColor": "lightgrey", "color": "blue", "weight": 0.5},).add_to(m)
m
#将subzone数据作为GeoJson添加到map中
4 制造伪数据,四个区域的用地类型分布
data={'JURONG WEST':{'industry':12.1,'residential':20.4,'comercial':1.5,'open space':36.3,'others':100-12.1-20.4-1.5-36.3},'ORCHARD':{'industry':0,'residential':49.1,'comercial':20.2,'open space':20.9,'others':100-0-49.1-20.2-20.9},'BISHAN':{'industry':0,'residential':48.2,'comercial':3.1,'open space':22.4,'others':100-0-48.2-3.1-22.4},'TUAS':{'industry':62.7,'residential':0,'comercial':0,'open space':19.8,'others':100-62.7-0-0-19.8}}5 绘制饼图
def pie_chart_popup(area_name, data):plt.figure(figsize=(5, 4))plt.pie([data[area_name]['industry'],data[area_name]['residential'],data[area_name]['comercial'],data[area_name]['open space'],data[area_name]['others']],labels=['industry', 'residential','comercial','open space','others'],autopct='%1.1f%%')plt.title('Land use of '+f"{area_name}")#绘制饼图plt.savefig(f'{area_name}'+'.png')return folium.Popup(f'<img src="{area_name}.png">', max_width=265)#Popup就是点这块区域,就会弹出后面的这个html,也就是我们所画的饼图6 将饼图和folium图结合
for subzone_name in data.keys():row=subzone[subzone['subzone_name']==subzone_name]#找到subzone对应的行folium.GeoJson(row,style_function=lambda x: {"fillColor": "green", "color": "#000000", "weight": 0.5},tooltip=subzone_name,  popup=pie_chart_popup(subzone_name, data)).add_to(m)#在地图中画出这个subzone#tooltip就是鼠标滑过这片区域,就会显示的字#popup就是点击后弹出对应的饼图m.save('subzone_proportion.html')
#保存html

)


ACL)

