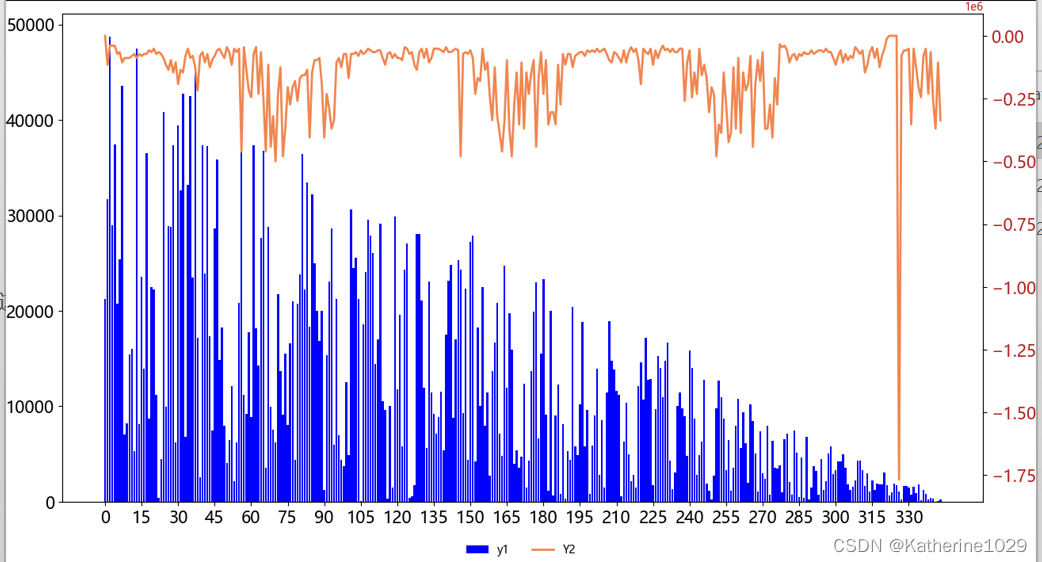
import matplotlib
matplotlib.use('Agg')  # 使用Agg后端,这个后端适用于生成图像文件但不显示它们
import matplotlib.pyplot as plt
fig = plt.figure(figsize=(15, 8))# 字体使用楷体
matplotlib.rc("font", family="Microsoft YaHei")
ax1 = fig.add_subplot(111)plt.xticks(np.arange(min(xlist), max(xlist) + 1, 15), color='#000000', fontsize=15)
ax1.bar(xlist, y1, color='#0000ff', label='left')ax2 = ax1.twinx()
ax2.plot(xlist, Y2, color='#F08650', linestyle='-', linewidth=2)
ax2.tick_params(axis='y', color='#000000', labelsize=15, labelcolor='#B22222') fig.legend(labels=('y1',"Y2"),loc='lower center',frameon=False,ncol=2)
plt.savefig(r"123.png", bbox_inches='tight', pad_inches=0)
plot(x, y, linestyle=None, marker=None, color=None, label=None, **kwargs)x : 一维数组或列表,表示数据点在X轴上的位置。
y : 一维数组或列表,表示数据点在Y轴上的位置。
linestyle : (可选参数) 字符串,表示线条的样式。默认值为None,表示使用默认的线条样式。你可以指定不同的线条样式,如实线('-')、虚线('--')、点划线('-.')、点线(':')等。
marker : (可选参数) 字符串,表示数据点的标记类型。默认值为None,表示不显示数据点的标记。你可以指定不同的标记类型,如圆圈('o')、方块('s')、三角形('^')等。
color : (可选参数) 字符串,表示线条和标记的颜色。默认值为None,表示使用默认的颜色。你可以使用颜色字符串,如'red'、'blue'、'green'等,也可以使用缩写颜色字符串,如'r'、'b'、'g'等。
label : (可选参数) 字符串,表示线条的标签。默认值为None。当你想为绘制的线条添加图例时,可以设置此标签。
**kwargs : (可选参数) 这是一些可选的关键字参数,用于配置线条的其他属性,比如线条宽度、透明度等。
通过传递 x 和 y 的数据,你可以使用 plot() 方法绘制一条线。 linestyle 参数可选,用于控制线条样式; marker 参数可选,用于显示数据点的标记; color 参数可选,用于指定线条和标记的颜色; label 参数可选,用于添加线条的标签,用于图例显示。
绘制多条线时,可以多次调用 plot() 方法,每次传递不同的 x 和 y 数据,并根据需要设置不同的样式和颜色。当绘制多条线时,你可以使用 label 参数为每条线添加标签,然后使用 plt.legend() 来显示图例
plt.scatter 来绘制散点图
matplotlib.pyplot.scatter(x, y, s=None, c=None, marker=None, cmap=None, norm=None, vmin=None, vmax=None, alpha=None, linew x :横坐标数据,是一个数组或Series,用于表示散点图中每个点的横坐标位置。
plt.bar 来绘制条形图
plt.bar(x, height, width=0.8, align='center', **kwargs)
plt.bar 来绘制水平条形图
plt.barh(y, width, height=0.8, left=None, **kwargs)
plt.pie 来绘制饼状图
plt.pie(x, explode=None, labels=None, colors=None, autopct=None, shadow=False, startangle=0, **kwargs)
1.pyplot.tick_params参数
axis——轴:{ ’ x ’ ,’ y ’ ,’ both ’ }
参数axis的值分别代表设置X轴、Y轴以及同时设置。默认值为 ’ both ’ 。
reset——重置:布尔
如果为True,则在处理其他关键字参数之前将所有参数设置为默认值。默认值为False。
which——其中:{ ‘ major ’ ,‘ minor ’ ,‘ both ’ }
参数which的值分别代表为“主要”,“次要”,“两者”。默认值为’ major '。
direction / tickdir——方向: {‘in’,‘out’,‘inout’}
将刻度线置于轴内,轴外或两者皆有。
size / length——长度:浮点
刻度线长度(以磅为单位)。
width——宽度:浮动
刻度线宽度(以磅为单位)。
color——颜色:颜色
刻度颜色;接受任何mpl颜色规格。
pad——垫:浮球
刻度和标签之间的距离(以磅为单位)。
labelsize——标签大小:float 或 str
刻度标签字体大小(以磅为单位)或字符串(例如,“大”)。
labelcolor——标签颜色:颜色
刻度标签颜色;mpl颜色规格
colors——颜色:颜色
将刻度颜色和标签颜色更改为相同的值:mpl color spec。
zorder——zorder:浮动
勾选并标记zorder。
bottom,top,left,right——底部,顶部,左侧,右侧:布尔
是否绘制各个刻度。
labelbottom,labeltop,labelleft,labelright——标签底部,标签顶部,标签左侧,标签右侧:布尔
是否绘制各个刻度标签。
labelrotation:浮动
刻度线标签逆时针旋转给定的度数
gridOn——网格线:布尔
是否添加网格线
grid_color——网格线颜色:颜色
将网格线颜色更改为给定的mpl颜色规格。
grid_alpha——网格线透明度:浮点数
网格线的透明度:0(透明)至1(不透明)。
grid_linewidth——网格线宽度:浮点数
网格线的宽度(以磅为单位)。
grid_linestyle——网格线型:字符串
任何有效的Line2D线型规范。
3.图例legend基础语法及用法
matplotlib.pyplot.legend(*args, **kwargs)
| Keyword | Description |
| loc | Location code string, or tuple (see below).图例所有figure位置 |
| prop | the font property字体参数 |
| fontsize | the font size (used only if prop is not specified) |
| markerscale | the relative size of legend markers vs. original 图例标记与原始标记的相对大小 |
| markerfirst | If True (default), marker is to left of the label. 如果为True,则图例标记位于图例标签的左侧 |
| numpoints | the number of points in the legend for line 为线条图图例条目创建的标记点数 |
| scatterpoints | the number of points in the legend for scatter plot 为散点图图例条目创建的标记点数 |
| scatteryoffsets | a list of yoffsets for scatter symbols in legend 为散点图图例条目创建的标记的垂直偏移量 |
| frameon | If True, draw the legend on a patch (frame). 控制是否应在图例周围绘制框架 |
| fancybox | If True, draw the frame with a round fancybox. 控制是否应在构成图例背景的FancyBboxPatch周围启用圆边 |
| shadow | If True, draw a shadow behind legend. 控制是否在图例后面画一个阴影 |
| framealpha | Transparency of the frame. 控制图例框架的 Alpha 透明度 |
| edgecolor | Frame edgecolor. |
| facecolor | Frame facecolor. |
| ncol | number of columns 设置图例分为n列展示 |
| borderpad | the fractional whitespace inside the legend border 图例边框的内边距 |
| labelspacing | the vertical space between the legend entries 图例条目之间的垂直间距 |
| handlelength | the length of the legend handles 图例句柄的长度 |
| handleheight | the height of the legend handles 图例句柄的高度 |
| handletextpad | the pad between the legend handle and text 图例句柄和文本之间的间距 |
| borderaxespad | the pad between the axes and legend border 轴与图例边框之间的距离 |
| columnspacing | the spacing between columns 列间距 |
| title | the legend title |
| bbox_to_anchor | the bbox that the legend will be anchored.指定图例在轴的位置 |
| bbox_transform | the transform for the bbox. transAxes if None. |
(1)设置图例位置
使用loc参数
| 0: ‘best' 1: ‘upper right' 2: ‘upper left' 3: ‘lower left' | 4: ‘lower right' 5: ‘right' 6: ‘center left' | 7: ‘center right' 8: ‘lower center' 9: ‘upper center' 10: ‘center' |
参考


)


根据今天日期获取一周内的日期(基姆拉尔森公式))


)

 提权)


)

