参考博客
https://markusdumke.github.io/articles/2017/11/make-matplotlib-look-like-ggplot/#exactline
theme_bw.mplstyle
# ggplot style with white background
# adapted from http://www.huyng.com/posts/sane-color-scheme-for-matplotlib/patch.linewidth: 1
patch.facecolor: 348ABD  # blue
patch.edgecolor: EEEEEE
patch.antialiased: Truefont.size: 10.0axes.facecolor: white # E5E5E5
axes.edgecolor: white
axes.linewidth: 0.5
axes.grid: True
axes.titlesize: x-large
axes.labelsize: large
axes.labelcolor: black # 555555
axes.axisbelow: True       # grid/ticks are below elements (e.g., lines, text)axes.prop_cycle: cycler('color', ['E24A33', '348ABD', '988ED5', '777777', 'FBC15E', '8EBA42', 'FFB5B8'])# E24A33 : red# 348ABD : blue# 988ED5 : purple# 777777 : gray# FBC15E : yellow# 8EBA42 : green# FFB5B8 : pinkxtick.color: 555555
ytick.color: 555555
ytick.direction: outgrid.color: 0.9
grid.linestyle: -    # solid linefigure.facecolor: white
figure.edgecolor: 0.50
python plot
import pandas as pd
import matplotlib.pyplot as plt
import numpy as np
from sklearn import datasets
# Load the theme_bw matplotlib theme
theme_bw = "./ggplot_style/theme_bw.mplstyle"
plt.style.use(theme_bw)
# Load the famous iris data
iris = datasets.load_iris()
# Convert to pandas data frame and rename columns
df = pd.DataFrame(data = np.c_[iris['data'], iris['target']],columns = iris['feature_names'] + ['target'])
df.rename(columns = {'sepal length (cm)': 'sepal_length', 'sepal width (cm)': 'sepal_width',"petal length (cm)": "petal_length","petal width (cm)": "petal_width","target": "species"}, inplace=True)
# Specify colors
col = ["#E24A33", "#FBC15E", "#348ABD"]
species = ["setosa", "versicolor", "virginica"]
# Plot
fig = plt.figure(figsize = (10, 12), dpi = 50)
ax = plt.subplot(111)
# A few tweaks to save the image in the same aspect ratio as the R graphic
fig.subplots_adjust(top = 0.8,bottom = 0.1,left = 0.1,right = 0.9)
# Add plot for each species
for i in np.unique(df["species"]):ax.plot(df[df["species"] == i]["sepal_length"], df[df["species"] == i]["sepal_width"], "o", markersize = 8,c = col[int(i)], label = species[int(i)])
plt.ylabel("Sepal Width")
plt.xlabel("Sepal Length")
plt.title("Iris", loc = "left")
# Add space for legend on the right
box = ax.get_position()
ax.set_position([box.x0, box.y0, box.width * 0.75, box.height])
# Add legend
ax.legend(bbox_to_anchor = (1, 0.6), title = "Species", labelspacing = 1.5)
# Remove minor ticks on x axis
plt.xticks(np.arange(5, max(df.sepal_length) + 1, 1.0))
plt.show()

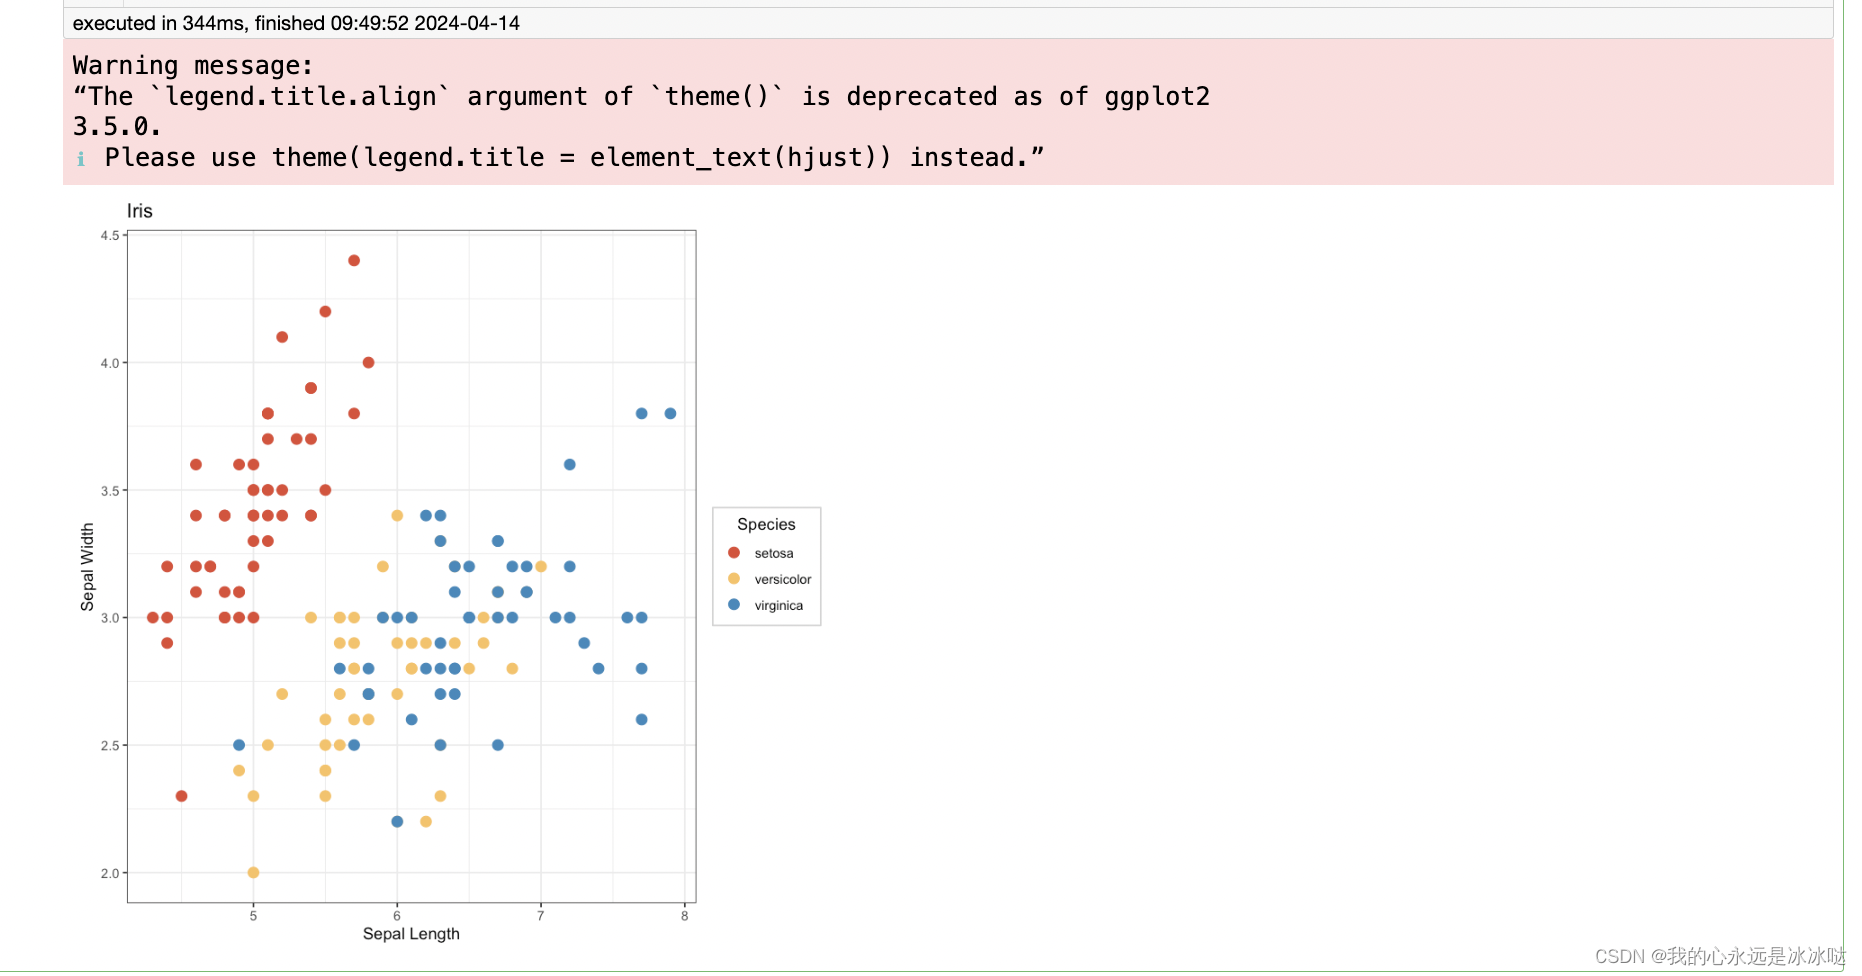
R_plot
library(ggplot2)
# Define colors
cols <- c("setosa" = "#E24A33", "virginica" = "#348ABD", "versicolor" = "#FBC15E")
g <- ggplot(data = iris, aes(x = Sepal.Length, y = Sepal.Width, col = factor(Species))) +geom_point(size = 3) +theme_bw() +xlab("Sepal Length") +ylab("Sepal Width") +ggtitle("Iris") +scale_colour_manual(values = cols) +guides(col = guide_legend(title = "Species")) +theme(legend.title.align = 0.5,legend.background = element_rect(colour = 'lightgrey', linetype = 'solid'))
g
结果如下


)


