文章目录
- 目标
- 数据集
- Logistic梯度下降
- 梯度下降实现
- 计算梯度,代码描述
- 另一个数据集
目标
在本实验中,你将:
- 更新逻辑回归的梯度下降
- 在一个熟悉的数据集上探索梯度下降
- 使用梯度下降给逻辑回归更新参数
import copy, math
import numpy as np
%matplotlib widget
import matplotlib.pyplot as plt
from lab_utils_common import  dlc, plot_data, plt_tumor_data, sigmoid, compute_cost_logistic
from plt_quad_logistic import plt_quad_logistic, plt_prob
plt.style.use('./deeplearning.mplstyle')
数据集
让我们从决策边界实验室中使用的相同的两个特征数据集开始。
X_train = np.array([[0.5, 1.5], [1,1], [1.5, 0.5], [3, 0.5], [2, 2], [1, 2.5]])
y_train = np.array([0, 0, 0, 1, 1, 1])
和前面一样,我们将使用一个辅助函数来绘制这些数据。标签y = 1的数据点显示为红色叉,而标签y = 0的数据点显示为蓝色圆。
fig,ax = plt.subplots(1,1,figsize=(4,4))
plot_data(X_train, y_train, ax)ax.axis([0, 4, 0, 3.5])
ax.set_ylabel('$x_1$', fontsize=12)
ax.set_xlabel('$x_0$', fontsize=12)
plt.show()

Logistic梯度下降

回想一下梯度下降算法利用了梯度计算:


梯度下降实现
梯度下降算法的实现有两个部分:
- 实现上述公式(1)的循环。这是下面的
gradient_descent,通常在可选和实践实验室中提供给您。 - 当前梯度的计算,如式(2、3)所示。这是下面的
compute_gradient_logistic。你将被要求完成本周的实践实验。
计算梯度,代码描述
对所有w和b实现上述式(2)、(3)。实现方法有很多,如下所示:
- 初始化变量,累加dj_dw和dj_db
- 对于每个例子
- 计算该示例的误差g(w·x^i +b)-y ^ i
- 对于本例中的每个输入值Xj^i,
- 将误差乘以输入的Xj^i,并加上dj_dw的相应元素。(上式2)
- 将错误添加到dj_db(上面的公式3)
- 用dj_db和dj_dw除以样本总数(m)
- 请注意,在numpy中X[i,:]或X[i]中的x^i和Xj ^i是X[i, j]
def compute_gradient_logistic(X, y, w, b): """Computes the gradient for linear regression Args:X (ndarray (m,n): Data, m examples with n featuresy (ndarray (m,)): target valuesw (ndarray (n,)): model parameters b (scalar) : model parameterReturnsdj_dw (ndarray (n,)): The gradient of the cost w.r.t. the parameters w. dj_db (scalar) : The gradient of the cost w.r.t. the parameter b. """m,n = X.shapedj_dw = np.zeros((n,)) #(n,)dj_db = 0.for i in range(m):f_wb_i = sigmoid(np.dot(X[i],w) + b) #(n,)(n,)=scalarerr_i = f_wb_i - y[i] #scalarfor j in range(n):dj_dw[j] = dj_dw[j] + err_i * X[i,j] #scalardj_db = dj_db + err_idj_dw = dj_dw/m #(n,)dj_db = dj_db/m #scalarreturn dj_db, dj_dw
使用下面的单元格检查梯度函数的实现。
X_tmp = np.array([[0.5, 1.5], [1,1], [1.5, 0.5], [3, 0.5], [2, 2], [1, 2.5]])
y_tmp = np.array([0, 0, 0, 1, 1, 1])
w_tmp = np.array([2.,3.])
b_tmp = 1.
dj_db_tmp, dj_dw_tmp = compute_gradient_logistic(X_tmp, y_tmp, w_tmp, b_tmp)
print(f"dj_db: {dj_db_tmp}" )
print(f"dj_dw: {dj_dw_tmp.tolist()}" )

梯度下降代码
实现上述方程(1)的代码如下所示。花点时间定位和比较例程中的函数与上面的方程。
def gradient_descent(X, y, w_in, b_in, alpha, num_iters): """Performs batch gradient descentArgs:X (ndarray (m,n) : Data, m examples with n featuresy (ndarray (m,)) : target valuesw_in (ndarray (n,)): Initial values of model parameters b_in (scalar) : Initial values of model parameteralpha (float) : Learning ratenum_iters (scalar) : number of iterations to run gradient descentReturns:w (ndarray (n,)) : Updated values of parametersb (scalar) : Updated value of parameter """# An array to store cost J and w's at each iteration primarily for graphing laterJ_history = []w = copy.deepcopy(w_in) #avoid modifying global w within functionb = b_infor i in range(num_iters):# Calculate the gradient and update the parametersdj_db, dj_dw = compute_gradient_logistic(X, y, w, b) # Update Parameters using w, b, alpha and gradientw = w - alpha * dj_dw b = b - alpha * dj_db # Save cost J at each iterationif i<100000: # prevent resource exhaustion J_history.append( compute_cost_logistic(X, y, w, b) )# Print cost every at intervals 10 times or as many iterations if < 10if i% math.ceil(num_iters / 10) == 0:print(f"Iteration {i:4d}: Cost {J_history[-1]} ")return w, b, J_history #return final w,b and J history for graphing让我们对数据集运行梯度下降。
w_tmp  = np.zeros_like(X_train[0])
b_tmp  = 0.
alph = 0.1
iters = 10000w_out, b_out, J = gradient_descent(X_train, y_train, w_tmp, b_tmp, alph, iters)
print(f"\nupdated parameters: w:{w_out}, b:{b_out}")

我们来绘制梯度下降的结果:
fig,ax = plt.subplots(1,1,figsize=(5,4))
# plot the probability
plt_prob(ax, w_out, b_out)# Plot the original data
ax.set_ylabel(r'$x_1$')
ax.set_xlabel(r'$x_0$')
ax.axis([0, 4, 0, 3.5])
plot_data(X_train,y_train,ax)# Plot the decision boundary
x0 = -b_out/w_out[1]
x1 = -b_out/w_out[0]
ax.plot([0,x0],[x1,0], c=dlc["dlblue"], lw=1)
plt.show()
这段代码看起来是用于在图表上绘制决策边界的部分。让我来解释每一行:
x0 = -b_out/w_out[1]
- 这行代码计算了决策边界上的两个点的 x 坐标值。假设 b_out 是模型的偏置项,w_out 是模型的权重参数。
x1 = -b_out/w_out[0]
- 这行代码计算了决策边界上的两个点的 y 坐标值。
ax.plot([0,x0],[x1,0], c=dlc["dlblue"], lw=1)
- 这行代码使用 Matplotlib 库中的 plot 函数,在图表上绘制了决策边界。它连接了两个点 (0, x0) 和 (x1, 0),即通过前面计算得到的两个点,从而画出了决策边界。参数 c 指定了线的颜色,lw 则指定了线的宽度

在上图中:
- 阴影反映了概率y=1(决策边界之前的结果)
- 决策边界是概率=0.5处的那条线
另一个数据集
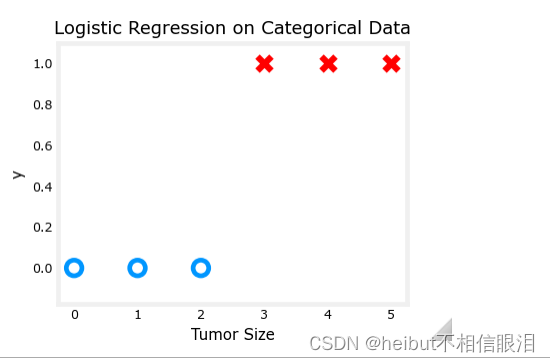
让我们回到单变量数据集。只需要两个参数,w, b,就可以绘制出成本函数使用等高线图来更好地了解梯度下降是什么。
x_train = np.array([0., 1, 2, 3, 4, 5])
y_train = np.array([0,  0, 0, 1, 1, 1])
和前面一样,我们将使用一个辅助函数来绘制这些数据。标签y = 1的数据点显示为红色叉,而标签y = 0的数据点显示为黑色圆。
fig,ax = plt.subplots(1,1,figsize=(4,3))
plt_tumor_data(x_train, y_train, ax)
plt.show()


w_range = np.array([-1, 7])
b_range = np.array([1, -14])
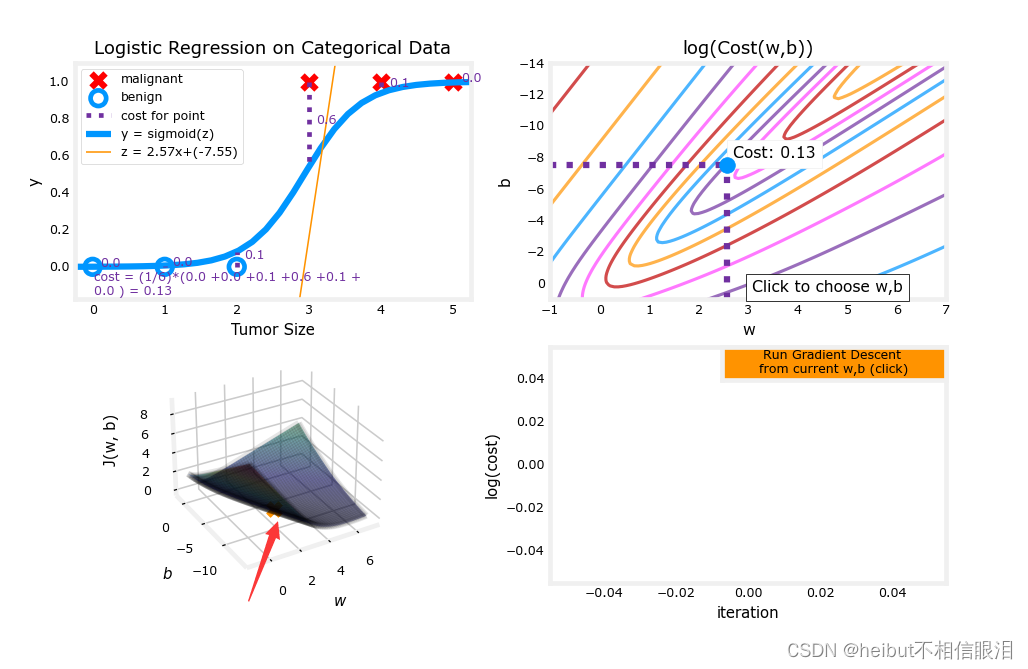
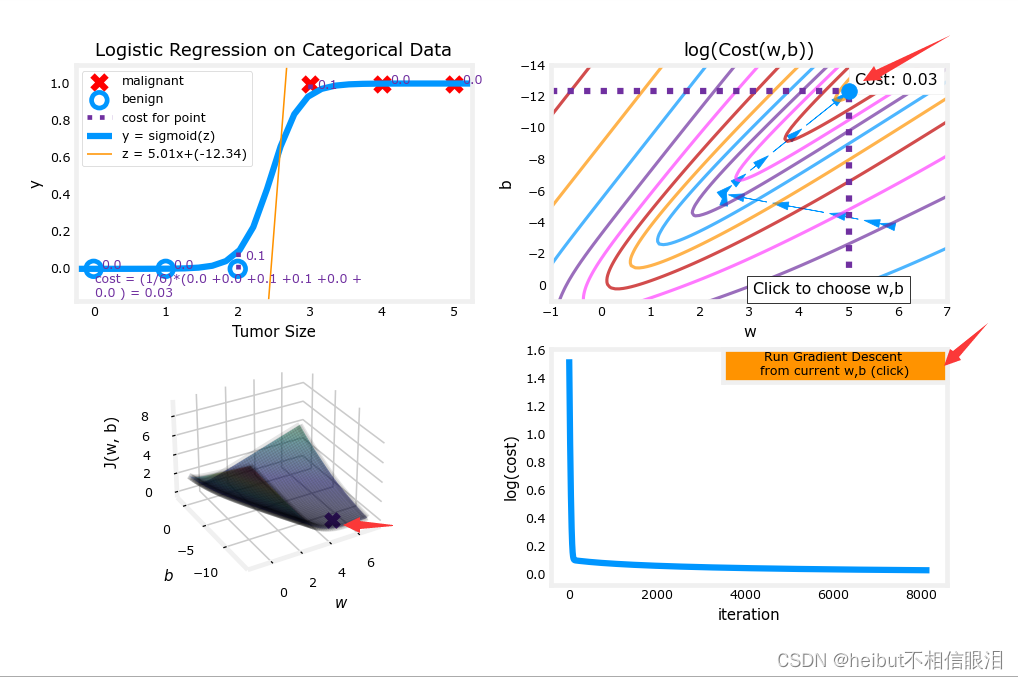
quad = plt_quad_logistic( x_train, y_train, w_range, b_range )
(1)
(2)

(3)
(4)点击运行之后


---->B. Equalize)


)


:服务器管理(十四)之监控磁盘使用)
