brief
over-representation analysis(ORA),过表“达”分析,就是我们做多分组的RNAseq数据解析后会得到一些差异表达的gene,有些时候是单独拿出一个差异gene去解释表型,缺点是欠缺证据力度。有些人就把一些相关的差异gene放在一块儿解释,比如这些差异gene在某个通路中高表达/低表达,从而引起了这种表型。
gene set(predetermined sets of genes that are related or coordinated in their expression in some way) 相关或者有某种程度关联的基因组成一个预先定义的gene list 。<------ 也就是我对这些来自样本数据解析后得到的基因感兴趣
所以,引申出来一种解释数据的方法,预先定义一个gene set,然后根据样本中属于gene set的gene 的表达量计算出一种分数,这个分数对表型的解释力度优先于一个差异 gene 表达量的解释力度。
ORA 就是一种计算gene set 分数的方法。其过程大致如下:
- 通过差异分析(limma或DESeq2等R包)基于不同的阈值设定(p-value以及log2FC)得到不同组间的差异表达基因DEG。
- 将DEG与感兴趣的基因集做交集(KEGG、GO、MSigDB等数据库),得到一些共同的基因。
- 基于超几何分布的Fisher检验来评估,抽到这些共同的基因的的计数值是否显著高于随机,即待测功能集在基因列表中是否显著富集。<------- 类似于两联表的fisher test
优点:基因集代表了一种通路/功能/调控/代谢等相关基因的集合,通过对基因集的整合分析,可以更好地解释数据和表型的关系。
缺点:1.仅使用了基因数目信息,而没有利用基因表达水平或表达差异值,为了获得感兴趣或者差异表达基因,需要人为的设置阈值
2.ORA法通常仅使用最显著的基因,而忽略差异不显著的基因。在获得感兴趣的基因时, 往往需要选取合适的阈值, 有可能会丢失显著性较低但比较关键的基因, 导致检测灵敏性的降低
3.将基因同等对待,ORA法假设每个基因都是独立的,忽视了基因在通路内部生物学意义的不同(如调控和被调控基因的不同)及基因间复杂的相互作用
4.ORA方法只关心差异表达基因而不关心其上调、下调的方向,也许同一条通路里既有显著高表达的基因,也有显著低表达的基因,因此最后得到的通路结果很难结合表型进行分析
代码演示
检验感兴趣的一些gene 在KEGG通路中是否富集:
# Over-representation testing using clusterProfiler is based on a hypergeometric test (often referred to as Fisher’s exact test) (Yu 2020).
#  For more background on hypergeometric tests, this handy tutorial explains more about how hypergeometric tests work (Puthier and van Helden 2015).
# or refer to https://blog.csdn.net/Luciferchang/article/details/115684092library(clusterProfiler)if (!("org.Hs.eg.db" %in% installed.packages())) {# Install this package if it isn't installed yetBiocManager::install("org.Hs.eg.db", update = FALSE)
}library(org.Hs.eg.db)
library(AnnotationDbi)# step1
# Determine our genes of interest list <--------- predetermined gene set
gs <- read.table("../20240305-manual-gene-set.txt")
# get gene id
gene_ids <- mapIds(org.Hs.eg.db, keys = gs$V1, keytype = "SYMBOL", column = "ENTREZID")# step2
# Determine our background set gene list <----- all or detected gene from RNAseq
background_set <- rownames(expr) # expr is gene expression matrix and rownames is all gene
background_gene_id <- mapIds(org.Hs.eg.db, keys = background_set, keytype = "SYMBOL", column = "ENTREZID")
# step3
# get kegg iterm
library(msigdbr)hs_msigdb_df <- msigdbr(species = "Homo sapiens")
# Filter the human data frame to the KEGG pathways that are included in the curated gene sets
hs_kegg_df <- hs_msigdb_df %>%dplyr::filter(gs_cat == "C2", # This is to filter only to the C2 curated gene setsgs_subcat == "CP:KEGG" # This is because we only want KEGG pathways
)# step4
# run fisher test
kegg_ora_results <- enricher(gene = gene_ids, # A vector of your genes of interestpvalueCutoff = 0.1, # Can choose a FDR cutoffpAdjustMethod = "BH", # Method to be used for multiple testing correctionuniverse = background_gene_id, # A vector containing your background set genes# The pathway information should be a data frame with a term name or# identifier and the gene identifiersTERM2GENE = dplyr::select(hs_kegg_df,gs_name,human_entrez_gene)
)#  visualization
kegg_result_df <- data.frame(kegg_ora_results@result)
kegg_result_df %>%dplyr::filter(p.adjust < 0.1)
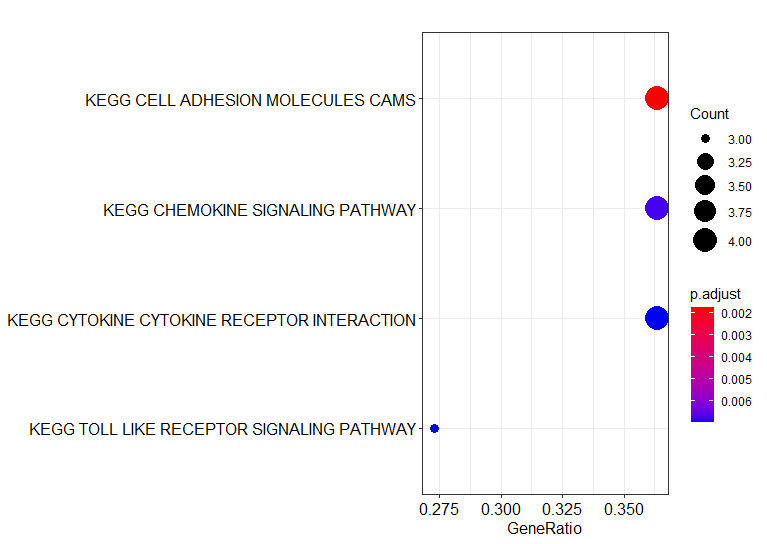
enrich_plot <- enrichplot::dotplot(kegg_ora_results)# Note: using enrichKEGG() is a shortcut for doing ORA using KEGG,
#  but the approach we covered here can be used with any gene sets you’d like!


——异常处理)
