决策树算法概述
基本概念
决策树:从根节点开始一步步走到叶子节点,每一步都是决策过程 对于判断的先后顺序把控特别严格 一旦将判断顺序进行变化则最终的结果将可能发生改变
往往将分类效果较佳的判断条件放在前面,即先初略分在进行细节分
所有的数据最终都将会落到叶子节点,树模型既可以做分类也可以做回归
树的组成:
根节点:第一个选择点
非叶子节点与分支:中间过程
叶子节点:最终的决策结果
决策树的训练与测试:
训练阶段:从给定的训练集构造出一棵树(从根节点开始选择特征,即判断条件等;如何进行特征切分)
测试阶段:根据构造出来的树模型从上至下运行一遍即可
熵
熵:是表示随机变量不确定性的度量,即物体内部的混乱程度
在实际运用过程中,熵值越低越好 在树模型构建时也是使得熵值降低的的好
信息增益
表示特征X使得类别Y的不确定性减少的程度。(分类后的专一性,希望分类后的结果是同类在一起)
即如何经过一个节点后左右子树的熵值之和比原来的要小,则信息增益为正
计算各个特征的信息增益,再选择最大的那个作为根节点 对于下一个节点其操作过程与选择根节点一致,每次都需要对剩下的特征进行遍历,选择出信息增益max的特征
信息增益存在的问题
当特征中存在非常稀疏,并且种类非常多的特征时,如id值 这时熵值经过该特征判断后值接近于0
信息增益率
公式为:信息增益/该节点的熵值
该方式很好的解决了信息增益所存在的问题
gini系数

如何处理连续值
选取连续值的哪个分界点:——对连续值的各个分界点进行尝试,判断每个分界点的信息增益率等,以选择最佳的分界点
剪枝策略
决策树过拟合风险很大,理论上可以将数据完全分开,即每个叶子节点只有一个数据

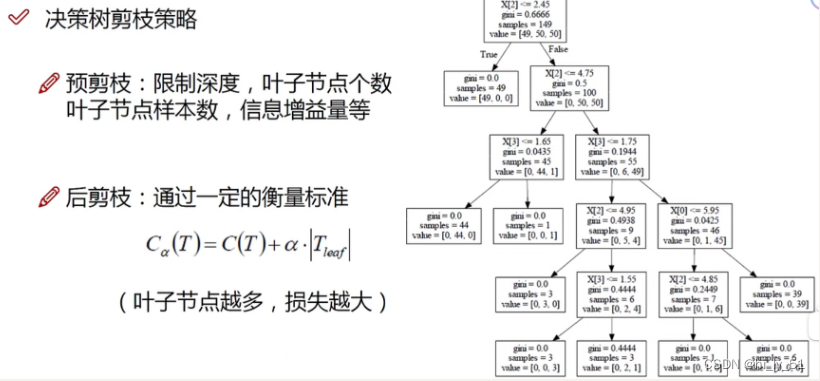
预剪枝
边建立决策树边进行剪枝操作
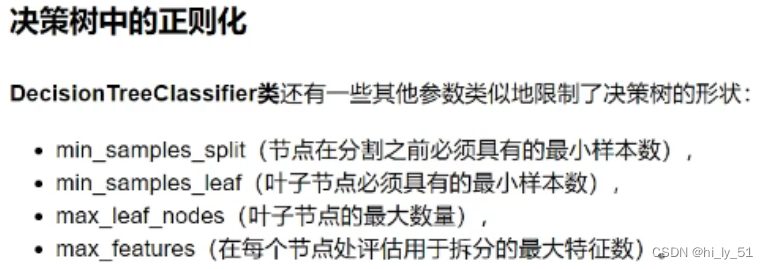
可以通过限制树的深度、叶子节点个数、叶子节点样本数、信息增益量等
预剪枝的参数都是需要通过实验不断的进行尝试来选择最佳参数的
后剪枝
建立完成决策树之后进行剪枝操作
在计算公式中ɑ的值需要自己设定,值越大说明希望自己的树模型越不过拟合,但是得到的结果可能不是很好;值越小说明希望结果好为主,对于过拟合程度不是很关注

C(T):gini系数或熵值
Tleaf:叶子节点个数
回归/分类问题解决
分类问题:
由于原始数据有自己的标签,对于最终的叶子节点,其类别所属类型使用众数方式,即何种类别数据多则该叶子节点属于该类型;
回归问题
回归由于没有具体的类别,因而无熵值。
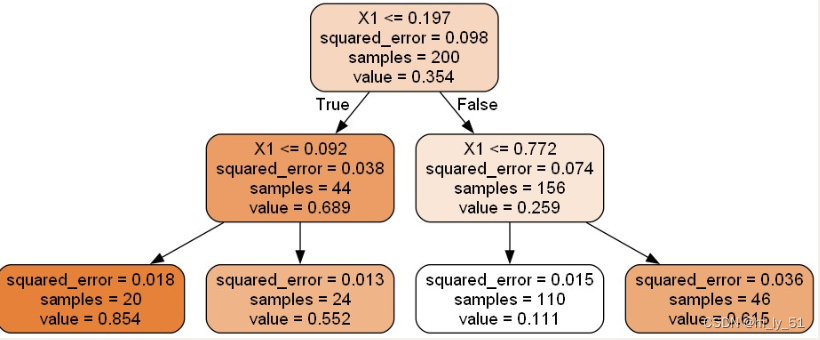
判断标准:方差
在进行预测时该节点的节点值等于其平均数
树模型的可视化展示
下载安装包:Download | Graphviz
环境变量配置:GraphViz如何配置环境变量并保存图片-百度经验 (baidu.com)
import numpy as np
import os
# %matplotlib inline
import matplotlib
import matplotlib.pyplot as pltplt.rcParams['axes.labelsize'] = 14
plt.rcParams['xtick.labelsize'] = 12
plt.rcParams['ytick.labelsize'] = 12
import warningswarnings.filterwarnings('ignore')'''导入鸢尾花数据集'''
from sklearn.datasets import load_iris
from sklearn.tree import DecisionTreeClassifieriris = load_iris()
X = iris.data[:, 2:]
y = iris.target'''创建决策树模型'''
tree_clf = DecisionTreeClassifier(max_depth=2)  ##max_depth限制决策树模型最大深度
tree_clf.fit(X,y)  ##模型训练'''画图展示决策树模型'''
from sklearn.tree import export_graphvizexport_graphviz(tree_clf,  ##当前树模型  之前训练好的树模型out_file="iris_tree.dot",  ##输出文件 .dot文件  后续会将其转为图片文件feature_names=iris.feature_names[2:],  ##绘图时展示的特征名字class_names=iris.target_names,rounded=True,filled=True
)
将在文件夹中生成一个.dot文件,
再利用之前下载好的软件将该文件转为png图片文件
dot -Tpng iris_tree.dot -o iris_tree.png

将会得到对应的png图片

'''使用代码的方式展示照片'''
from IPython.display import Image
Image(filename="iris_tree.png",width=400,height=400)
##前提是已经将dot文件转为相关的照片格式
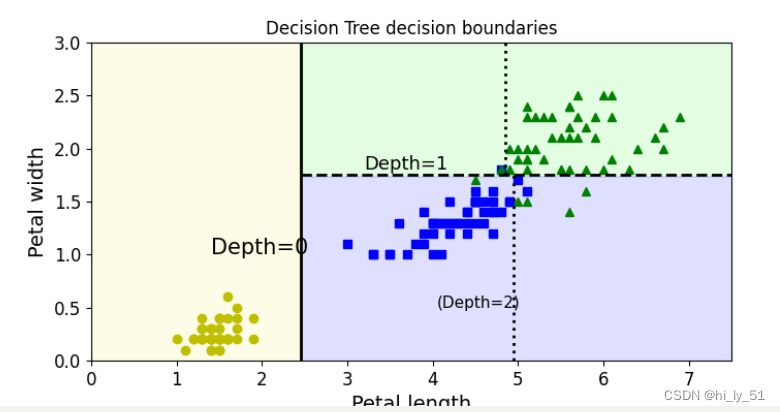
决策树的决策边界展示
import numpy as np
import os
# %matplotlib inline
import matplotlib
import matplotlib.pyplot as pltplt.rcParams['axes.labelsize'] = 14
plt.rcParams['xtick.labelsize'] = 12
plt.rcParams['ytick.labelsize'] = 12
import warningswarnings.filterwarnings('ignore')'''导入鸢尾花数据集'''
from sklearn.datasets import load_iris
from sklearn.tree import DecisionTreeClassifieriris = load_iris()
X = iris.data[:, 2:]
y = iris.target'''创建决策树模型'''
tree_clf = DecisionTreeClassifier(max_depth=2)  ##max_depth限制决策树模型最大深度
tree_clf.fit(X, y)  ##模型训练print(tree_clf.predict_proba([[5, 1.5]]))  ##预测概率值
'''绘制决策边界'''
from matplotlib.colors import ListedColormapdef plot_decision_boundary(clf, X, y, axes=[0, 7.5, 0, 3], iris=True, legend=False, plot_training=True):##找特征x1s = np.linspace(axes[0], axes[1], 100)x2s = np.linspace(axes[2], axes[3], 100)# 构建棋盘x1, x2 = np.meshgrid(x1s, x2s)##在棋盘中构建待测试数据X_new = np.c_[x1.ravel(), x2.ravel()]##预测最终结果值y_pred = clf.predict(X_new).reshape(x1.shape)##确定绘制的颜色  与等高线样式custom_cmap = ListedColormap(['#fafab0', '#9898ff', '#a0faa0'])plt.contourf(x1, x2, y_pred, alpha=0.3, cmap=custom_cmap)if not iris:custom_cmap2 = ListedColormap(['#7d7d58', '#4c4c7f', '#507d50'])plt.contour(x1, x2, y_pred, cmap=custom_cmap2, alpha=0.8)if plot_training:plt.plot(X[:, 0][y == 0], X[:, 1][y == 0], "yo", label="Iris-Setosa")plt.plot(X[:, 0][y == 1], X[:, 1][y == 1], "bs", label="Iris-Versicolor")plt.plot(X[:, 0][y == 2], X[:, 1][y == 2], "g^", label="Iris-Virginica")plt.axis(axes)if iris:plt.xlabel("Petal length", fontsize=14)plt.ylabel("Petal width", fontsize=14)else:plt.xlabel(r"$x_1$", fontsize=18)plt.ylabel(r"Sx_2$", fontsize=18, rotation=0)if legend:plt.legend(loc="lower right", fontsize=14)plt.figure(figsize=(8, 4))
plot_decision_boundary(tree_clf, X, y)
###传入实际的位置值  即切割位置
plt.plot([2.45, 2.45], [0, 3], "k-", linewidth=2)
plt.plot([2.45, 7.5], [1.75, 1.75], "k--", linewidth=2)
plt.plot([4.95, 4.95], [0, 1.75], "k:", linewidth=2)
plt.plot([4.85, 4.85], [1.75, 3], "k:", linewidth=2)
plt.text(1.40, 1.0, "Depth=0", fontsize=15)
plt.text(3.2, 1.80, "Depth=1", fontsize=13)
plt.text(4.05, 0.5, "(Depth=2)", fontsize=11)
plt.title('Decision Tree decision boundaries')
plt.show()
树模型预剪枝参数作用

通常max_features不做限制,默认情况下全部使用,除非特征数非常多;max_depth(树最大的深度)
import numpy as np
import os
# %matplotlib inline
import matplotlib
import matplotlib.pyplot as pltplt.rcParams['axes.labelsize'] = 14
plt.rcParams['xtick.labelsize'] = 12
plt.rcParams['ytick.labelsize'] = 12
import warningswarnings.filterwarnings('ignore')'''绘制决策边界'''
from matplotlib.colors import ListedColormapdef plot_decision_boundary(clf, X, y, axes=[0, 7.5, 0, 3], iris=True, legend=False, plot_training=True):##找特征x1s = np.linspace(axes[0], axes[1], 100)x2s = np.linspace(axes[2], axes[3], 100)# 构建棋盘x1, x2 = np.meshgrid(x1s, x2s)##在棋盘中构建待测试数据X_new = np.c_[x1.ravel(), x2.ravel()]##预测最终结果值y_pred = clf.predict(X_new).reshape(x1.shape)##确定绘制的颜色  与等高线样式custom_cmap = ListedColormap(['#fafab0', '#9898ff', '#a0faa0'])plt.contourf(x1, x2, y_pred, alpha=0.3, cmap=custom_cmap)if not iris:custom_cmap2 = ListedColormap(['#7d7d58', '#4c4c7f', '#507d50'])plt.contour(x1, x2, y_pred, cmap=custom_cmap2, alpha=0.8)if plot_training:plt.plot(X[:, 0][y == 0], X[:, 1][y == 0], "yo", label="Iris-Setosa")plt.plot(X[:, 0][y == 1], X[:, 1][y == 1], "bs", label="Iris-Versicolor")plt.plot(X[:, 0][y == 2], X[:, 1][y == 2], "g^", label="Iris-Virginica")plt.axis(axes)if iris:plt.xlabel("Petal length", fontsize=14)plt.ylabel("Petal width", fontsize=14)else:plt.xlabel(r"$x_1$", fontsize=18)plt.ylabel(r"Sx_2$", fontsize=18, rotation=0)if legend:plt.legend(loc="lower right", fontsize=14)from sklearn.tree import DecisionTreeClassifierfrom sklearn.datasets import make_moonsX, y = make_moons(n_samples=100, noise=0.25, random_state=53)  ##构造数据
tree_clf1 = DecisionTreeClassifier(random_state=42)
tree_clf2 = DecisionTreeClassifier(min_samples_leaf=4, random_state=42)  # 设置min_samples_leaf参数
tree_clf1.fit(X, y)
tree_clf2.fit(X, y)
##绘图展示对比
plt.figure(figsize=(12, 4))
plt.subplot(121)
plot_decision_boundary(tree_clf1, X, y, axes=[-1.5, 2.5, -1, 1.5], iris=False)
plt.title("min_samples_leaf=4")
plt.subplot(122)
plot_decision_boundary(tree_clf2, X, y, axes=[-1.5, 2.5, -1, 1.5], iris=False)
plt.title("No restrictions")
plt.show()

回归树模型
树模型对数据的形状较为敏感,当对数据进行旋转等变换后其得到的结果也是不同的
回归树与其他的不同的于 其使用的不是gini系数而是均方误差mse
import numpy as np
import os
# %matplotlib inline
import matplotlib
import matplotlib.pyplot as pltplt.rcParams['axes.labelsize'] = 14
plt.rcParams['xtick.labelsize'] = 12
plt.rcParams['ytick.labelsize'] = 12
import warningswarnings.filterwarnings('ignore')
'''构造数据'''
np.random.seed(42)
m = 200
X = np.random.rand(m, 1)
y = 4 * (X - 0.5) ** 2
y = y + np.random.randn(m, 1) / 10'''导入包 但是不同于分类决策树的包'''from sklearn.tree import DecisionTreeRegressortree_reg = DecisionTreeRegressor(max_depth=2)
tree_reg.fit(X, y)
from sklearn.tree import export_graphvizexport_graphviz(tree_reg,  ##当前树模型  之前训练好的树模型out_file="regression_tree.dot",  ##输出文件 .dot文件  后续会将其转为图片文件feature_names=["X1"],  ##绘图时展示的特征名字rounded=True,filled=True
)
sklearn工具包中都是使用CRT算法,即得到的都是二叉树


![[数据集][图像分类]黄瓜叶子病害分类数据集172张3类别](http://pic.xiahunao.cn/[数据集][图像分类]黄瓜叶子病害分类数据集172张3类别)


查询开发板的外设地址信息)


