目录
时间分辨率(Temporal Resolution)
1.Landsat
2.Sentinel-2
时间分辨率(Temporal Resolution)
时间分辨率是指特定传感器图像流的重访时间或时间节奏,重访时间是指卫星连续访问地球表面同一位置之间的天数, 可以将其视为给定位置的时间序列中像素的频率。
1.Landsat
Landsat 5 及更高版本能够每 16 天对给定位置进行成像,让我们使用 Landsat 5 中现有的TM数据集。要查看某个位置的图像时间序列,您可以将 ImageCollection 过滤为区域和日期范围 感兴趣的,然后打印出来。 例如,要查看 1987 年三个月的 Landsat 5 图像,请运行以下代码:
/
// Explore Temporal Resolution
/
// Use Print to see Landsat revisit time
print('Landsat-5 series:', tm.filterBounds(Map.getCenter()).filterDate('1987-06-01', '1987-09-01'));
图1 Landsat影像名称及要素属性
// Define a region of interest as a point at San Francisco airport.
var sfoPoint = ee.Geometry.Point(-122.3774, 37.6194);
// Center the map at that point.
Map.centerObject(sfoPoint, 16);
// Create a chart to see Landsat 5's 16 day revisit time.
var tmChart = ui.Chart.image.series({
imageCollection: tm.select('B4').filterDate('1987-06-01','1987-09-01'),
region: sfoPoint
}).setSeriesNames(['NIR']);
在控制台输出中展开打印的 ImageCollection 的功能属性,以查看集合中所有图像的列表。观察到每个图像的日期是文件名的一部分(例如,LANDSAT/LT05/C02/ T1/ LT05_ 044034 _19870612) (图1)。但是,查看此列表并不容易看出数据集的时间分辨率。 我们可以使用 Earth Engine 的绘图功能来可视化不同数据集的时间分辨率。 对于每个不同的时间分辨率,我们将创建之前映射的 NIR 波段的每像素图表。为此,我们将使用 ui.Chart.image.series 函数,ui.Chart.image.series 函数要求您指定一些内容,以便计算每个时间步的图表点。 首先,我们过滤 ImageCollection(您也可以在函数外部执行此操作,然后直接指定 ImageCollection)。 我们选择B4(近红外)波段,然后使用ImageCollection上的filterDate选择三个月。接下来,我们需要指定要绘制图表的位置, 我们将使用我们之前定义的 sfoPoint 变量(在空间分辨率部分创建的)。
// Create a chart to see Landsat 5's 16 day revisit time.
var tmChart = ui.Chart.image.series({imageCollection: tm.select('B4').filterDate('1987-06-01','1987-09-01'),region: sfoPoint}).setSeriesNames(['NIR']);
默认情况下,此函数创建一条趋势线。 很难准确地看到每张图像的收集时间,因此让我们创建一个专门的图表样式,为每个观察结果添加点。
// Define a chart style that will let us see the individual dates.
var chartStyle = {hAxis: {title: 'Date'},vAxis: {title: 'NIR Mean'},series: {0: {lineWidth: 3,pointSize: 6}},
};
// Apply custom style properties to the chart.
tmChart.setOptions(chartStyle);
// Print the chart.
print('TM Chart', tmChart);
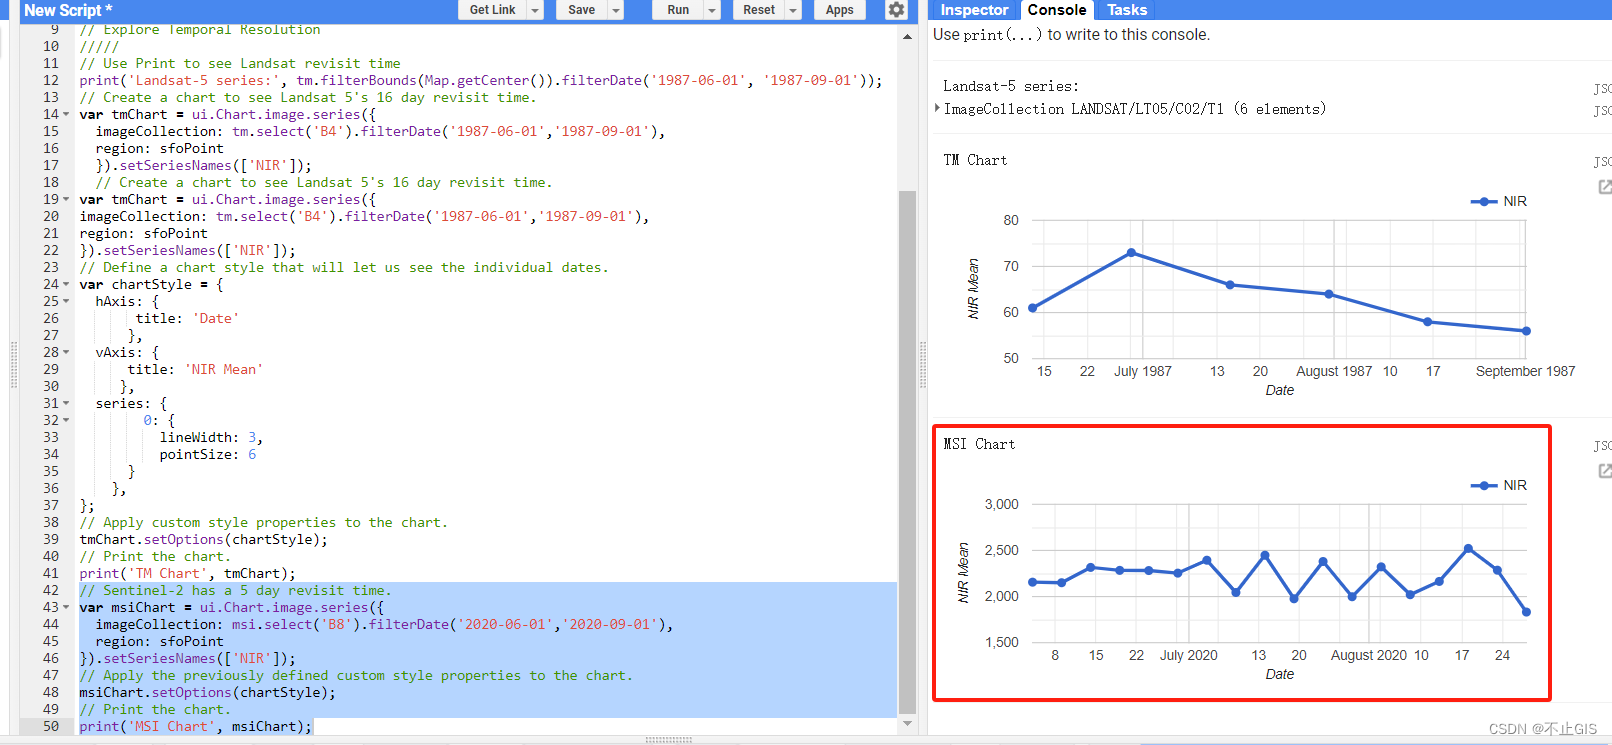
打印图表时,TM 传感器每次采集图像时都会有一个点(图 3)。 在控制台中,您可以将鼠标移动到不同的点上并查看更多信息。 另外注意,您可以使用右上角的按钮展开图表,我们将看到更多图表示例,特别是在第四部分的章节中。

图2 旧金山机场 Landsat 5 TM 传感器的时间分辨率的图表
2.Sentinel-2
Sentinel-2 计划的两颗卫星位于协调轨道上,因此地球上的每个地点大约每 5 天就会被访问一次。 在 Earth Engine 中,来自这两个传感器的图像汇集在同一数据集中,让我们使用已经导入的 MSI 仪器数据集创建一个图表。
// Sentinel-2 has a 5 day revisit time.
var msiChart = ui.Chart.image.series({imageCollection: msi.select('B8').filterDate('2020-06-01','2020-09-01'),region: sfoPoint
}).setSeriesNames(['NIR']);
// Apply the previously defined custom style properties to the chart.
msiChart.setOptions(chartStyle);
// Print the chart.
print('MSI Chart', msiChart);
将此 Sentinel-2 图(图 3)与您刚刚生成的 Landsat 图(图 2)进行比较。 两者都涵盖3个月的时间,但 Sentinel-2 卫星的时间点更多,反映出更高的时间分辨率。
 图 3 显示旧金山机场 Sentinel-2 MSI传感器的时间分辨率的图表


主页面布局)
![【洛谷 P8706】[蓝桥杯 2020 省 AB1] 解码 题解(模拟+输入输出)](http://pic.xiahunao.cn/【洛谷 P8706】[蓝桥杯 2020 省 AB1] 解码 题解(模拟+输入输出))


)