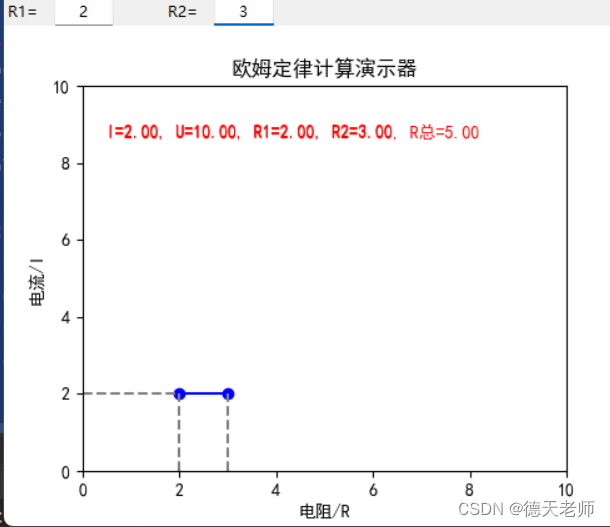
上述代码是一个基于Python的图形用户界面(GUI)应用程序,用于演示欧姆定律。用户可以通过输入电阻值来计算电流,并在图形上显示结果。该程序使用了Tkinter库来创建GUI,matplotlib库来绘制图形,以及numpy库进行数值计算。
输出效果图:

使用该代码的好处有以下几点:
直观易用:该程序提供了图形界面,用户可以通过简单的输入和操作来了解欧姆定律的计算过程。
实时更新:程序能够实时更新电流、电压和电阻值的计算结果,以及在图形上显示相应的点。
可扩展性:该程序使用了模块化设计,可以根据需要添加更多的功能和计算方法。
可移植性强:由于该程序使用了Python语言编写,可以在不同操作系统和平台上运行,方便用户在不同环境中使用。
import tkinter as tk
from tkinter import ttk
import matplotlib.pyplot as plt
from matplotlib.backends.backend_tkagg import FigureCanvasTkAggclass App:def __init__(self, root):self.root = rootself.resistance_value1 = tk.StringVar()self.resistance_value2 = tk.StringVar()  # New variable for second resistance valueself.voltage = 10.0  # 假设电压为10V# 创建标签并添加到界面上label1 = tk.Label(root, text="R1=")label1.grid(row=0, column=0, sticky='w')  # 使用sticky参数来确保标签不会移动label2 = tk.Label(root, text="R2=")label2.grid(row=0, column=1, sticky='w')  # 使用sticky参数来确保标签不会移动self.entry1 = ttk.Entry(root, justify='center', textvariable=self.resistance_value1, width=6)self.entry1.grid(row=0, column=0)self.entry1.bind('<Return>', self.update_light_bulb)  # 绑定回车键事件self.entry2 = ttk.Entry(root, justify='center', textvariable=self.resistance_value2, width=6)self.entry2.grid(row=0, column=1)  # Place second entry on the right sideself.entry2.bind('<Return>', self.update_light_bulb)  # 绑定回车键事件self.figure, self.ax = plt.subplots(figsize=(5, 4), dpi=100)self.canvas = FigureCanvasTkAgg(self.figure, self.root)self.canvas.draw()self.canvas.get_tk_widget().grid(row=1, columnspan=5)  # Adjust to fit both entries and the canvasself.resistance1 = 0self.resistance2 = 0self.current = 0self.ax.set_title("欧姆定律")self.update_graph()def update_light_bulb(self, event=None):new_value1 = self.resistance_value1.get()new_value2 = self.resistance_value2.get()if float(new_value1) == 0 or float(new_value2) == 0:print("错误: 电阻值不能为零")return  # 提前返回,不执行后续的代码self.resistance1 = float(new_value1)self.resistance2 = float(new_value2)self.current = self.voltage / (self.resistance1 + self.resistance2)  # Update current based on both resistancesself.update_graph()def update_graph(self):if self.resistance1 == 0 and self.resistance2 == 0:returnself.ax.clear()x_limit = max(self.voltage / (self.resistance1 + self.resistance2), self.resistance1 + self.resistance2)self.ax.set_xlim(0, x_limit + 5)  # Adjust x-axis limit based on both resistances combinedself.ax.set_ylim(0, max(self.voltage, 1))# Plot both resistances and the combined current value (blue dot)self.ax.plot([self.resistance1, self.resistance2], [self.current, self.current], marker='o', color='blue')self.ax.set_xlabel('电阻/R')self.ax.set_ylabel('电流/I')self.ax.set_title('欧姆定律计算演示器')text = f"I={self.current:.2f}, U={self.voltage:.2f}, R1={self.resistance1:.2f}, R2={self.resistance2:.2f}"self.ax.text(0.05, 0.9, text, verticalalignment='top', horizontalalignment='left', transform=self.ax.transAxes,color='red')total_res


---单调栈)
![[每日一题] 01.26 - 最长连号](http://pic.xiahunao.cn/[每日一题] 01.26 - 最长连号)
——CAN解包 DLC Bug)
)
:IOC介绍及代码实现)

)
赋值 ?使用下标赋值出错,不能使用标赋值吗?)

Diff-DOPE: Differentiable Deep Object Pose Estimation)


)


