GDAL栅格数据处理
- 栅格数据介绍
- 栅格数据读取
- 读取部分数据集
- 坐标变换
- 重采样
什么是栅格数据
- 基本上是一个大的二维或三维数组
- 没有独立的几何对象,只有像素的集合
- 二维:黑白图片
- 三维:彩色/假彩色,多光谱/高光谱
- 可以存储几乎任何类型的数据
- 体积比较大
- 应用场景:遥感、气象、水文、农业、海洋……
栅格数据都能存储什么?
- 高程、坡度、坡向
- 温度、风速、降水、蒸发
- 可见光、近红外、微波等遥感数据
栅格数据小知识
- 栅格数据的仿射变换与几何校正:通过一组坐标,像素的大小和数据集的旋转量
- 存储空间:双精度浮点数>单精度浮点数>整数>无符号整数
- 概视图:递减分辨率,用于大数据快速显示
- 有损压缩与无损压缩:地理科学数据应使用无损压缩
GDAL数据集的基本结构
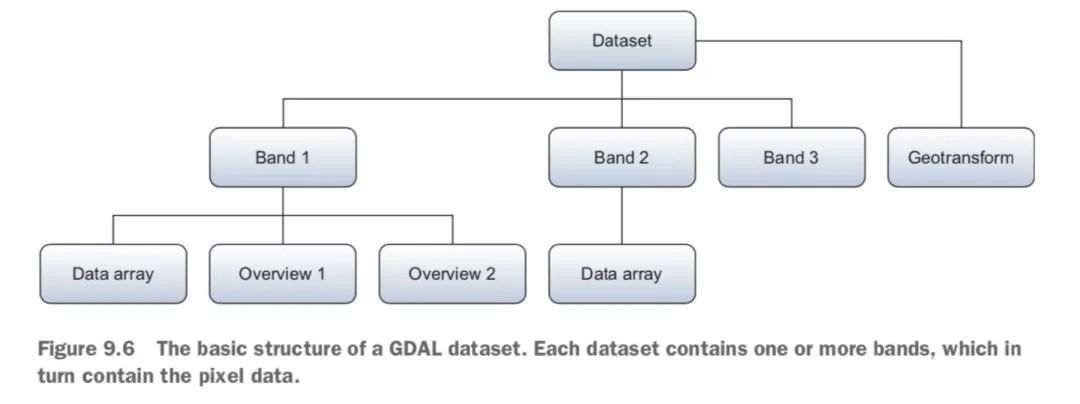
栅格数据读取
driver.Create(filename, xsize, ysize, [bands], [data_type], [options])- filename: 文件名,创建一个新文件
- xsize: x方向,列数
- ysize: y方向,行数
- bands: 波段数,默认值为1,从1开始(不是从0开始)
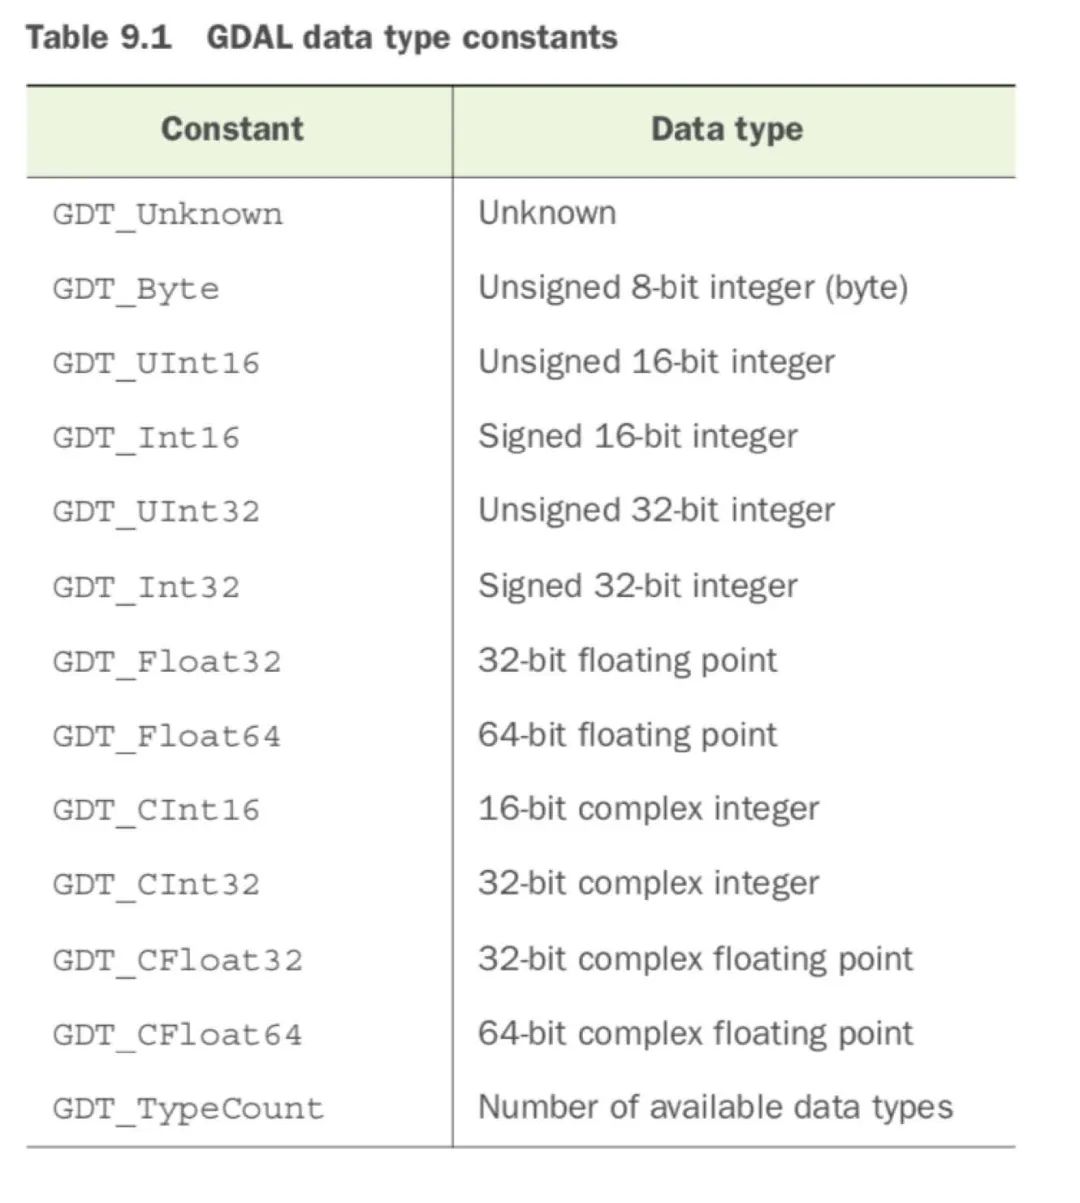
- data_type: 数据类型,默认为GDT_Byte(8位无符号整型)
- options: 其它选项,按数据类型而有所不同
GDAL支持的数据类型
# 导入gdal,注意导入的名称import osfrom osgeo import gdal #或者直接用import gdalfrom matplotlib import pyplot as pltimage_data_dir = 'D:\BaiduNetdiskDownload\Landsat\Washington'# Be sure to change your directory.# 切换当前路径os.chdir(image_data_dir)band1_fn = 'p047r027_7t20000730_z10_nn10.tif'band2_fn = 'p047r027_7t20000730_z10_nn20.tif'band3_fn = 'p047r027_7t20000730_z10_nn30.tif'# 打开波段1(注意这里是从1开始数)# Open band 1.in_ds = gdal.Open(band1_fn)# 用索引1,而不是0,来获取第一个波段in_band = in_ds.GetRasterBand(1)plt.imshow(in_band.ReadAsArray(),cmap='gray')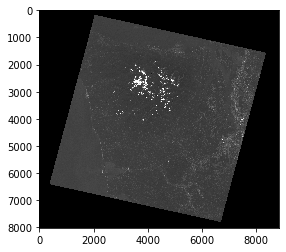
# Create a 3-band GeoTIFF with the same dimensions, data type, projection,# and georeferencing info as band 1. This will be overwritten if it exists.# 使用驱动对象来创建数据集,因为使用的是GeoTIFF驱动,无论给它任何扩展名,输出的文件都是GeoTIFFgtiff_driver = gdal.GetDriverByName('GTiff')out_ds = gtiff_driver.Create('nat_color.tif', in_band.XSize, in_band.YSize, 3, in_band.DataType)# 重要:获取空间信息# 第一句:得到投影(SRS)并复制到新的数据集# 第二句:得到geotransform信息并复制到新的数据集# 两者的信息都很重要。# 前者与矢量数据类似,包含有完整的空间参考信息;# 后者提供原始坐标、像素大小、旋转值,是栅格数据独有的out_ds.SetProjection(in_ds.GetProjection())out_ds.SetGeoTransform(in_ds.GetGeoTransform())0
print(out_ds.GetProjection())PROJCS["WGS 84 / UTM zone 10N",GEOGCS["WGS 84",DATUM["WGS_1984",SPHEROID["WGS 84",6378137,298.257223563,AUTHORITY["EPSG","7030"]],AUTHORITY["EPSG","6326"]],PRIMEM["Greenwich",0,AUTHORITY["EPSG","8901"]],UNIT["degree",0.0174532925199433,AUTHORITY["EPSG","9122"]],AUTHORITY["EPSG","4326"]],PROJECTION["Transverse_Mercator"],PARAMETER["latitude_of_origin",0],PARAMETER["central_meridian",-123],PARAMETER["scale_factor",0.9996],PARAMETER["false_easting",500000],PARAMETER["false_northing",0],UNIT["metre",1,AUTHORITY["EPSG","9001"]],AXIS["Easting",EAST],AXIS["Northing",NORTH],AUTHORITY["EPSG","32610"]]
print(out_ds.GetGeoTransform())(343724.25, 28.5, 0.0, 5369585.25, 0.0, -28.5)
# Copy data from band 1 into the output image.# 向输出数据源out_ds写入数据# 先取出想要写入的波段# 再将numpy数组in_data的数据写入in_data = in_band.ReadAsArray()out_band = out_ds.GetRasterBand(3)out_band.WriteArray(in_data)0
# Copy data from band 2 into the output image.# 读取波段2,直接从数据集中读取像素句柄in_ds = gdal.Open(band2_fn)out_band = out_ds.GetRasterBand(2)out_band.WriteArray(in_ds.ReadAsArray())0
# Copy data from band 3 into the output image.# 读取波段3,更简洁的写法out_ds.GetRasterBand(1).WriteArray( gdal.Open(band3_fn).ReadAsArray())0
# Compute statistics on each output band.# 计算每个波段的统计量# 注意用range(1,4)表示在波段1,2,3之间循环# 统计每个波段的:平均值、最小值、最大值、标准差# 参数取False:从现有数据直接计算,True:用概视图估计值out_ds.FlushCache()for i in range(1, 4): out_ds.GetRasterBand(i).ComputeStatistics(False)# 建立概视图# Build overview layers for faster display.out_ds.BuildOverviews('average', [2, 4, 8, 16, 32])# 关闭数据源,这个时候才将内存中的对象写入硬盘# This will effectively close the file and flush data to disk.del out_ds# 打开QGIS,或者ArcGIS,看看输出文件读取部分数据集
上述案例读取了整个波段(band)的数据
但是有的时候数据太大了,内存装不下;或者我们只用其中很小一块,没必要全部读取,这时候就需要分块读取
分块读取波段数据,读入后输出numpy数组:
band.ReadAsArray([xoff], [yoff], [win_xsize], [win_ysize], [buf_xsize], [buf_ysize], [buf_obj])- xoff: 列读取的起点,默认为0
- yoff: 行读取的起点,默认为0
- win_xsize: 要读取的列数,默认读取所有列
- win_ysize: 要读取的行数,默认读取所有行
- buf_xsize: 输出数组里的列数,默认用win_xsize的值,如果值不同于win_xsize,则会重新采样
- buf_ysize: 输出数组里的行数,默认用win_ysize的值,如果值不同于win_ysize,则会重新采样
- buf_obj: 是一个事先创建好的numpy数组,读取的结果会存入这个数组,而不是新建一个。如果需要,数据将会重采样以适应这个数组,值将会转换为这种数组的类型。
读取部分数据集举例:
从第1400列,6000行开始,读取6列3行,不做重采样
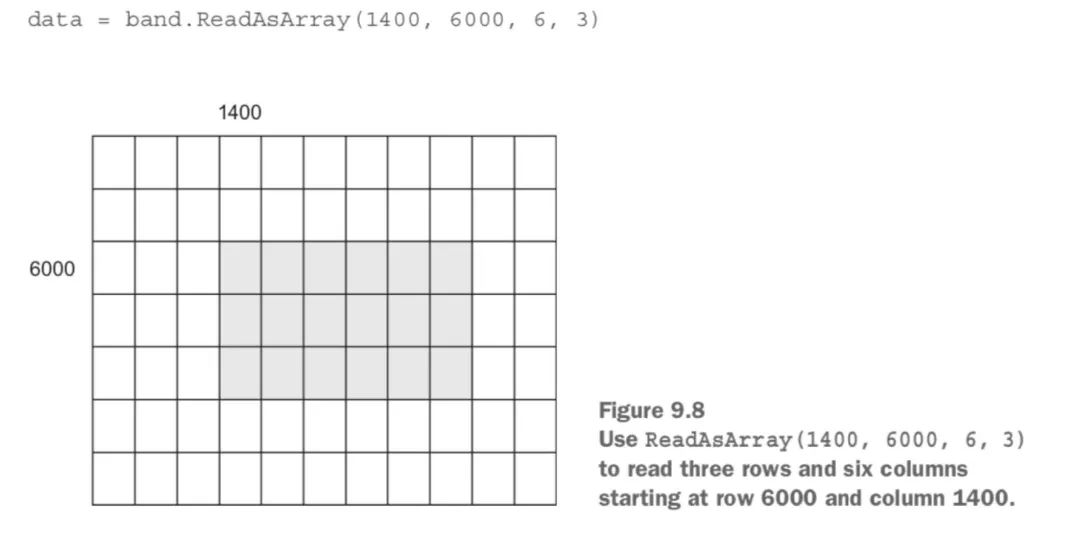
注意读取数据的数组下标不要越界!GDAL并不会自动帮你处理下标越界的问题,它只会报错。因此特别当你想用部分读取的方式处理一个很大的文件时,对边界的处理需要你特别的注意,必须正好读完不能越界也不能少读。
逐块处理大数据
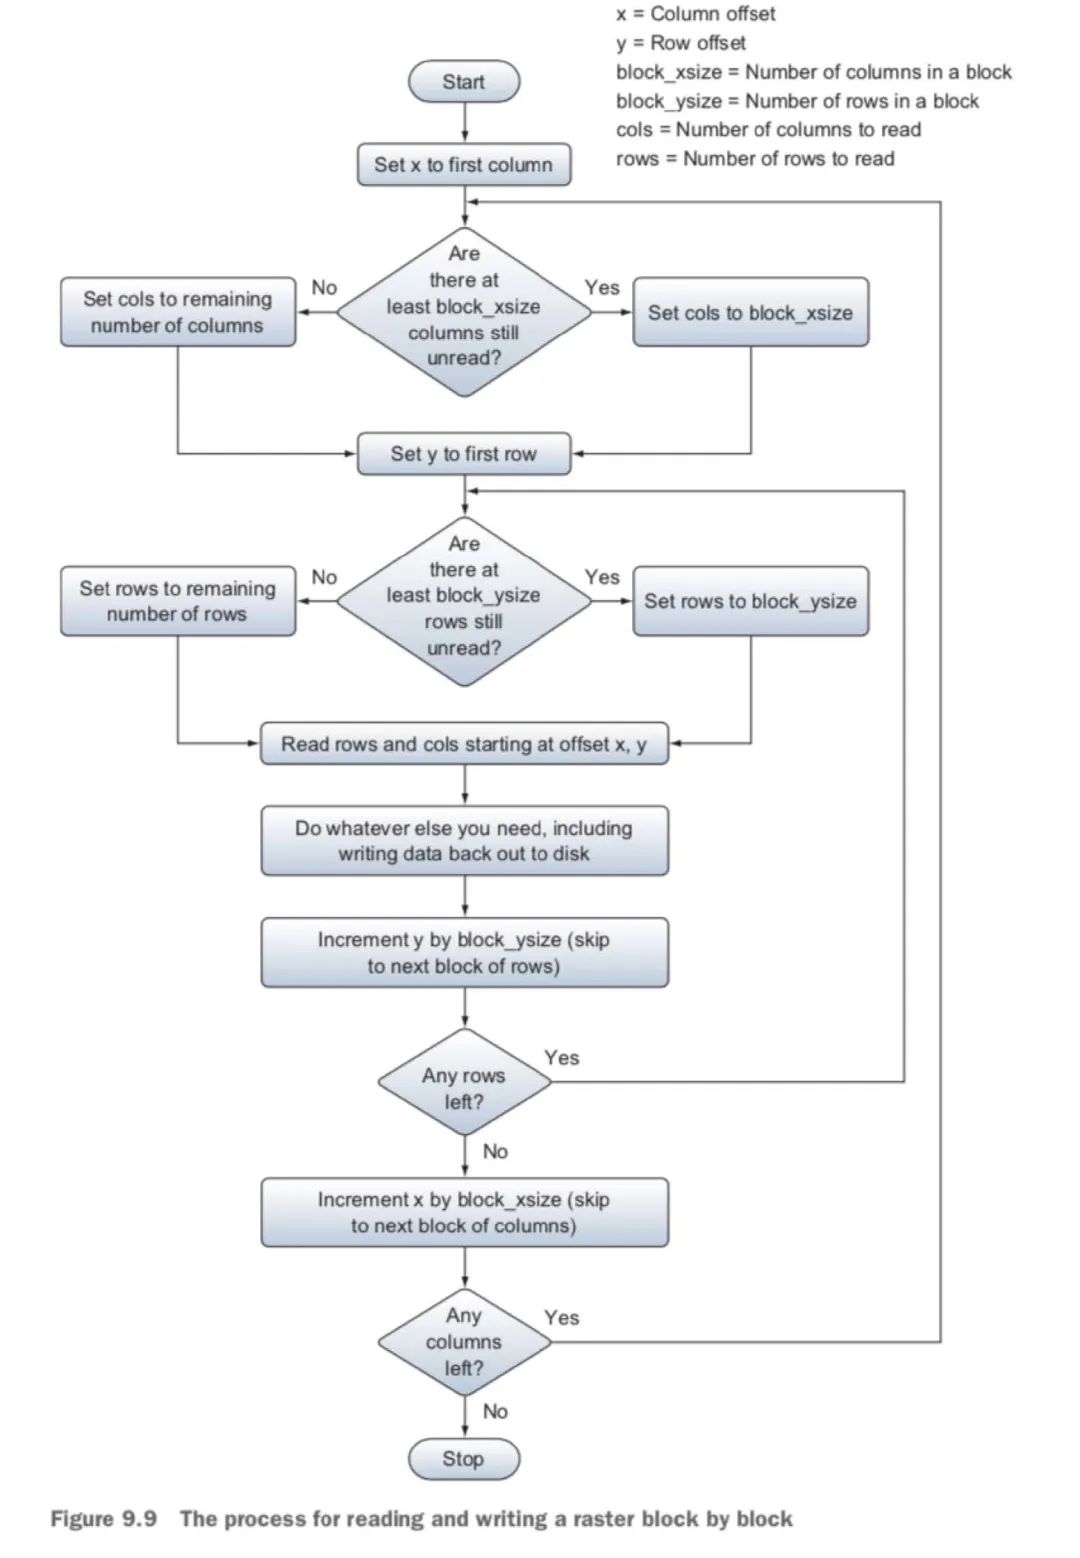
- 如果数据太大,内存放不下,可以每次读取部分数据集。流程如下:
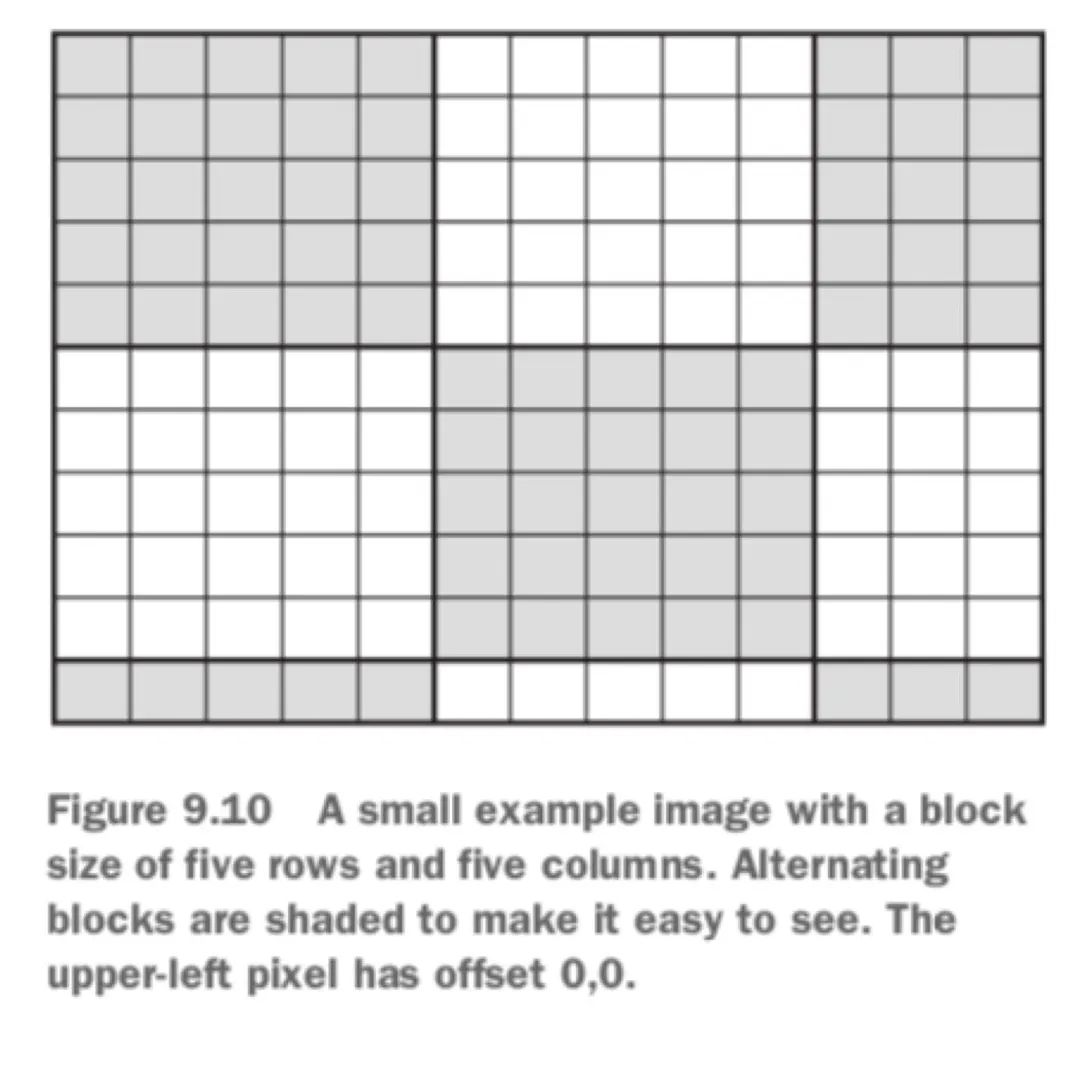
- 用ReadAsArray逐块读取数据举例
- 处理11行13列的栅格数据
- 块大小为5行5列
- 在右边界自动转换为3列
- 在下边界自动转换为1行
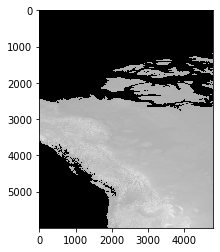
# 逐块处理大数据案例# 将数字高程模型的单位从米转换为英尺import osimport numpy as npfrom osgeo import gdal# 先切换路径data_dir = 'D:\BaiduNetdiskDownload\dem'os.chdir(data_dir)# Open the input raster and get its dimensions.# 打开tif文件,读取文件的尺寸,块大小,nodata值等属性in_ds = gdal.Open('gt30w140n90.tif')in_band = in_ds.GetRasterBand(1)xsize = in_band.XSizeysize = in_band.YSizeprint(xsize,ysize)# Get the block size and NoData value.block_xsize, block_ysize = in_band.GetBlockSize()nodata = in_band.GetNoDataValue()print(block_xsize,block_ysize,nodata)plt.imshow(in_band.ReadAsArray(),cmap='gray')4800 6000
4800 1 -9999.0
# 新建输出数据源# Create an output file with the same dimensions and data type.out_ds = in_ds.GetDriver().Create( 'dem_feet.tif', xsize, ysize, 1, in_band.DataType)out_ds.SetProjection(in_ds.GetProjection())out_ds.SetGeoTransform(in_ds.GetGeoTransform())out_band = out_ds.GetRasterBand(1)# 二重循环,逐块读取数据# Loop through the blocks in the x direction.for x in range(0, xsize, block_xsize): # Get the number of columns to read. if x + block_xsize < xsize: cols = block_xsize else: cols = xsize - x # Loop through the blocks in the y direction. for y in range(0, ysize, block_ysize): # Get the number of rows to read. if y + block_ysize < ysize: rows = block_ysize else: rows = ysize - y # 对其中的每一小块,将其单位从米转换为英尺(乘以常数),写入输出波段 # Read in one block's worth of data, convert it to feet, and then # write the results out to the same block location in the output. data = in_band.ReadAsArray(x, y, cols, rows) data = np.where(data == nodata, nodata, data * 3.28084) out_band.WriteArray(data, x, y)# 计算统计量,建立概视图,写入数据源等收尾工作# Compute statistics after flushing the cache and setting the NoData value.out_band.FlushCache()out_band.SetNoDataValue(nodata)out_band.ComputeStatistics(False)out_ds.BuildOverviews('average', [2, 4, 8, 16, 32])del out_ds# 打开QGIS,或者ArcGIS,看看输出文件坐标变换
到目前为止,我们都在像处理数组一样处理栅格数据,只考虑了像素偏移,没有考虑真实世界的坐标
坐标的转换并不困难,需要用到:
- 栅格数据的SRS(空间参考)信息
- geotransform也就是栅格数据的地理变换信息
需要使用GDAL提供的函数
- ApplyGeoTransform()
- GetGeoTransform()
- InvGeoTransform()
读取geotransform信息,这是gt变换对象
gt = ds.GetGeoTransform()
生成一个逆变换:
- GDAL 2.X以上版本:
inv_gt = gdal.InvGeoTransform(gt) - GDAL 1.X版本:
success, inv_gt = gdal.InvGeoTransform(gt)
- GDAL 2.X以上版本:
使用逆变换将坐标转换为数组偏移量
offsets = gdal.ApplyGeoTransform(inv_gt, 465200, 5296000)xoff, yoff = map(int, offsets)value = band.ReadAsArray(xoff, yoff, 1, 1)[0,0]
# 读取geotransform信息# Get the geotransform from one of the Landsat bands.os.chdir(image_data_dir)ds = gdal.Open('p047r027_7t20000730_z10_nn10.tif')band = ds.GetRasterBand(1)gt = ds.GetGeoTransform()print(gt)(343724.25, 28.5, 0.0, 5369585.25, 0.0, -28.5)
# 生成一个逆变换# Now get the inverse geotransform. The original can be used to convert# offsets to real-world coordinates, and the inverse can be used to convert# real-world coordinates to offsets.# GDAL 1.x: You get a success flag and the geotransform.# success, inv_gt = gdal.InvGeoTransform(gt)# print(success, inv_gt)# GDAL 2.x: You get the geotransform or Noneinv_gt = gdal.InvGeoTransform(gt)print(inv_gt)(-12060.5, 0.03508771929824561, 0.0, 188406.5, 0.0, -0.03508771929824561)
# 生成数组偏移量# Use the inverset geotransform to get some pixel offsets from real-world# UTM coordinates (since that's what the Landsat image uses). The offsets# are returned as floating point.offsets = gdal.ApplyGeoTransform(inv_gt, 465200, 5296000)print(offsets)[4262.307017543859, 2581.9385964912362]
# 将偏移量转换为整数# Convert the offsets to integers.xoff, yoff = map(int, offsets)print(xoff, yoff)4262 2581
# 按照偏移量读取一个像元# And use them to read a pixel value.value = band.ReadAsArray(xoff, yoff, 1, 1)[0,0]print(value)62
# 调用ReadAsArray函数比较耗资源,# 所以最好不要调用次数特别多,特别是不要每个栅格点都调用# 可以先把大量数据读入内存,再按照偏移量取出对应位置的像元# Reading in one pixel at a time is really inefficient if you need to read# a lot of pixels, though, so here's how you could do it by reading in all# of the pixel values first and then pulling out the one you need.data = band.ReadAsArray()x, y = map(int, gdal.ApplyGeoTransform(inv_gt, 465200, 5296000))value = data[y, x] # 注意numpy需要的偏移量为[行, 列],与GDAL的恰恰相反,GDAL为[列,行]!print(value)62
# 坐标变换案例:从整幅的landsat影像中截取华盛顿州Vashon岛(给定Vashon岛图幅左上角和右下角的坐标)import osfrom osgeo import gdal# Vashon岛图幅左上角和右下角的坐标# Coordinates for the bounding box to extract.vashon_ulx, vashon_uly = 532000, 5262600vashon_lrx, vashon_lry = 548500, 5241500# 载入数据os.chdir(os.path.join(data_dir, 'Landsat', 'Washington'))in_ds = gdal.Open('nat_color.tif')# 生成逆变换# Create an inverse geotransform for the raster. This converts real-world# coordinates to pixel offsets.in_gt = in_ds.GetGeoTransform()inv_gt = gdal.InvGeoTransform(in_gt)# 自动判断GDAL的版本if gdal.VersionInfo()[0] == '1': if inv_gt[0] == 1: inv_gt = inv_gt[1] else: raise RuntimeError('Inverse geotransform failed')elif inv_gt is None: raise RuntimeError('Inverse geotransform failed')# 计算偏移量# Get the offsets that correspond to the bounding box corner coordinates.offsets_ul = gdal.ApplyGeoTransform( inv_gt, vashon_ulx, vashon_uly)offsets_lr = gdal.ApplyGeoTransform( inv_gt, vashon_lrx, vashon_lry)# 转换为整数# The offsets are returned as floating point, but we need integers.off_ulx, off_uly = map(int, offsets_ul)off_lrx, off_lry = map(int, offsets_lr)# 从偏移量计算出Vashon岛图幅的行数和列数# Compute the numbers of rows and columns to extract, based on the offsets.rows = off_lry - off_ulycolumns = off_lrx - off_ulx# 新建输出数据源# Create an output raster with the correct number of rows and columns.gtiff_driver = gdal.GetDriverByName('GTiff')out_ds = gtiff_driver.Create('vashon.tif', columns, rows, 3)out_ds.SetProjection(in_ds.GetProjection())0
# 设定输出数据源的坐标变换,注意要修改坐标起点# Convert the offsets to real-world coordinates for the georeferencing info.# We can't use the coordinates above because they don't correspond to the# pixel edges.subset_ulx, subset_uly = gdal.ApplyGeoTransform(in_gt, off_ulx, off_uly)out_gt = list(in_gt)out_gt[0] = subset_ulxout_gt[3] = subset_ulyout_ds.SetGeoTransform(out_gt)# 本案例的很多内容是之前内容的重复# 最重要的是计算Vashon岛左上角和右下角的坐标对应的偏移值# 打印出来比较一下print(in_gt)print(out_gt)(343724.25, 28.5, 0.0, 5369585.25, 0.0, -28.5)
[531995.25, 28.5, 0.0, 5262624.75, 0.0, -28.5]
# 按偏移量读取数据,存入新的文件# Loop through the 3 bands.for i in range(1, 4): in_band = in_ds.GetRasterBand(i) out_band = out_ds.GetRasterBand(i) # Read the data from the input raster starting at the computed offsets. data = in_band.ReadAsArray(off_ulx, off_uly, columns, rows) # Write the data to the output, but no offsets are needed because we're # filling the entire image. out_band.WriteArray(data)del out_ds# 打开QGIS,或者ArcGIS,看看输出文件重采样
在数据读取的时候就可以一并进行重采样
band.ReadAsArray([xoff], [yoff], [win_xsize], [win_ysize], [buf_xsize], [buf_ysize], [buf_obj])通过制定buf_xsize和buf_ysize的大小来实现
如果它们比win_xsize和win_ysize大,那么会重采样为更高的分辨率,更小的像素
如果它们比win_xsize和win_ysize小,那么会重采样为更低的分辨率,更大的像素,使用最邻近插值来实现!
重采样为更高分辨率,更小的像素

重采样为更低分辨率,更大的像素

# 重采样举例# Get the first band from the raster created with listing 8.1.os.chdir(os.path.join(data_dir, 'Landsat', 'Washington'))ds = gdal.Open('nat_color.tif')band = ds.GetRasterBand(1)# 读入2行3列# Read in 2 rows and 3 columns.original_data = band.ReadAsArray(1400, 6000, 3, 2)print(original_data)[[28 29 29]
[28 30 29]]
# 重采样为6行4列# Now resample those same 2 rows and 3 columns to a smaller pixel size by# doubling the number of rows and columns to read (now 4 rows and 6 columns).resampled_data = band.ReadAsArray(1400, 6000, 3, 2, 6, 4)print(resampled_data)[[28 28 29 29 29 29]
[28 28 29 29 29 29]
[28 28 30 30 29 29]
[28 28 30 30 29 29]]
# 读入6行4列# Read in 4 rows and 6 columns.original_data2 = band.ReadAsArray(1400, 6000, 6, 4)print(original_data2)[[28 29 29 27 25 25]
[28 30 29 25 32 28]
[27 27 28 30 25 29]
[26 26 27 30 25 30]]
# 重采样为2行3列# Now resample those same 4 rows and 6 columns to a larger pixel size by# halving the number of rows and columns to read (now 2 rows and 3 columns).resampled_data2 = band.ReadAsArray(1400, 6000, 6, 4, 3, 2)print(resampled_data2)[[28 28 28]
[28 28 28]]
下一期我们会讲到利用ogr读取矢量数据。点击阅读原文获取代码中示例数据,提取码为svqw。
欢迎扫码关注。

:命令学习4)
)
)
:命令学习5)


)


)
)

:arraylist集合实现类)
![BZOJ5020: [THUWC 2017]在美妙的数学王国中畅游(LCT,泰勒展开,二项式定理)](http://pic.xiahunao.cn/BZOJ5020: [THUWC 2017]在美妙的数学王国中畅游(LCT,泰勒展开,二项式定理))

:list迭代器和包含方法)


:vector类)
