摘要 (Summary)
In this article, using Data Science and Python, I will show how different Clustering algorithms can be applied to Geospatial data in order to solve a Retail Rationalization business case.
在本文中,我将使用数据科学和Python演示如何将不同的聚类算法应用于地理空间数据,以解决零售合理化业务案例。
Store Rationalization is the reorganization of a company in order to increase its operating efficiency and decrease costs. As a result of the Covid-19 crisis, several retail businesses from all around the world are closing stores. That is not exclusively a symptom of financial distress, in fact many companies have been focusing their investments on making their business more digital.
商店合理化是为了提高公司的运营效率和降低成本而对公司进行的重组。 Covid-19危机的结果是,来自世界各地的多家零售企业都关闭了商店。 这不仅是财务困境的征兆,事实上,许多公司一直将其投资重点放在使业务数字化上。
Clustering is the task of grouping a set of objects in such a way that observations in the same group are more similar to each other than to those in other groups. It is one of the most popular applications of the Unsupervised Learning (Machine Learning when there is no target variable).
聚类 任务是将一组对象进行分组,以使同一组中的观察彼此之间的相似度高于其他组中的观察。 它是无监督学习 (当没有目标变量时的机器学习)最受欢迎的应用之一。
Geospatial analysis is the field of Data Science that processes satellite images, GPS coordinates, and street addresses to apply to geographic models.
地理空间分析是数据科学领域,其处理卫星图像,GPS坐标和街道地址以应用于地理模型。
In this article, I’m going to use clustering with geographic data to solve a retail rationalization problem. I will present some useful Python code that can be easily applied in other similar cases (just copy, paste, run) and walk through every line of code with comments so that you can replicate this example (link to the full code below).
在本文中,我将使用集群与地理数据来解决零售合理化问题。 我将介绍一些有用的Python代码,这些代码可以轻松地应用于其他类似情况(只需复制,粘贴,运行),并在每行代码中添加注释,以便您可以复制此示例(链接至下面的完整代码)。
I will use the “Starbucks Stores dataset” that provides the location of all the stores in operation (link below). I shall select a particular geographic area and, in addition to the latitude and longitude provided, I will simulate some business information for each store in the dataset (cost, capacity, staff).
我将使用“ 星巴克商店数据集 ”,它提供了所有正在运营的商店的位置(下面的链接)。 我将选择一个特定的地理区域,除了提供的纬度和经度之外,我还将模拟数据集中每个商店的一些业务信息(成本,容量,员工)。
In particular, I will go through:
特别是,我将经历:
- Setup: import packages, read geographic data, create business features. 设置:导入软件包,读取地理数据,创建业务功能。
Data Analysis: presentation of the business case on the map with folium and geopy.
数据分析:使用大叶 草和geopy在地图上呈现业务案例。
Clustering: Machine Learning (K-Means / Affinity Propagation) with scikit-learn, Deep Learning (Self Organizing Map) with minisom.
聚类:具有scikit-learn的机器学习(K均值/亲和力传播),具有minisom的深度学习(自组织图)。
- Store Rationalization: build a deterministic algorithm to solve the business case. 商店合理化:构建确定性算法来解决业务案例。
建立 (Setup)
First of all, I need to import the following packages.
首先,我需要导入以下软件包。
## for data
import numpy as np
import pandas as pd## for plotting
import matplotlib.pyplot as plt
import seaborn as sns## for geospatial
import folium
import geopy## for machine learning
from sklearn import preprocessing, cluster
import scipy## for deep learning
import minisom
Then I shall read the data into a pandas Dataframe.
然后,我将数据读入pandas Dataframe。
dtf = pd.read_csv('data_stores.csv')The original dataset contains over 5,000 cities and 25,000 stores, but for the purpose of this tutorial, I will work with just one city.
原始数据集包含5,000多个城市和25,000个商店,但是出于本教程的目的,我将仅处理一个城市。
filter = "Las Vegas"dtf = dtf[dtf["City"]==filter][["City","Street Address","Longitude","Latitude"]].reset_index(drop=True)dtf = dtf.reset_index().rename(columns={"index":"id"})
dtf.head()
In that area, there are 156 stores. In order to proceed with the business case, I’m going to simulate some information for each store:
在那个地区,有156家商店。 为了继续进行业务案例,我将为每个商店模拟一些信息 :
Potential: total capacity in terms of staff (e.g. 10 means that the store can have up to 10 employees)
潜力 :以员工人数计算的总容量(例如10表示商店最多可容纳10名员工)
Staff: current staff level (e.g. 7 means that the store is currently operating with 7 employees)
员工 :当前员工级别(例如7表示商店目前有7名员工)
Capacity: current left capacity (e.g. 10–7=3, the store can still host 3 employees)
容量 :当前剩余容量(例如10–7 = 3,商店仍可容纳3名员工)
Cost: annual cost for the company to keep the store operating (“low”, “medium”, “high”)
成本 :公司维持商店运营的年度成本(“ 低 ”,“ 中 ”,“ 高 ”)
dtf["Potential"] = np.random.randint(low=3, high=10+1, size=len(dtf))dtf["Staff"] = dtf["Potential"].apply(lambda x: int(np.random.rand()*x)+1)dtf["Capacity"] = dtf["Potential"] - dtf["Staff"]dtf["Cost"] = np.random.choice(["high","medium","low"], size=len(dtf), p=[0.4,0.5,0.1])dtf.head()
Please note that this is just a simulation, these numbers are generated randomly and don’t actually reflect Starbucks (or any other company) business.
请注意,这只是一个模拟,这些数字是随机生成的,实际上并不反映星巴克(或任何其他公司)的业务。
Now that it’s all set, I will start by analyzing the business case, then build a clustering model and a rationalization algorithm.
现在已经准备就绪,我将首先分析业务案例,然后构建聚类模型和合理化算法。
Let’s get started, shall we?
让我们开始吧,好吗?
数据分析 (Data Analysis)
Let’s pretend we own a retail business and we have to close some stores. We would want to do that maximizing the profit (by minimizing the cost) and without laying off any staff.
假设我们拥有一家零售企业,而我们不得不关闭一些商店。 我们希望做到这一点,以最大化利润(通过最小化成本)并且不裁员。
The costs are distributed as follows:
成本分配如下:
x = "Cost"ax = dtf[x].value_counts().sort_values().plot(kind="barh")
totals = []
for i in ax.patches:
    totals.append(i.get_width())
total = sum(totals)
for i in ax.patches:
     ax.text(i.get_width()+.3, i.get_y()+.20,
     str(round((i.get_width()/total)*100, 2))+'%',
     fontsize=10, color='black')
ax.grid(axis="x")
plt.suptitle(x, fontsize=20)
plt.show()
Currently, only a small portion of stores are running at full potential (left Capacity = 0), meaning that there are some with really low staff (high left Capacity):
当前,只有一小部分商店正以全部潜力运营(左产能= 0),这意味着有些员工的数量真的很低(左产能很高):

Let’s visualize those pieces of information on a map. First of all, I need to get the coordinates of the geographic area to start up the map. I shall do that with geopy:
让我们在地图上可视化这些信息。 首先,我需要获取地理区域的坐标才能启动地图。 我将用geopy做到这一点 :
city = "Las Vegas"## get location
locator = geopy.geocoders.Nominatim(user_agent="MyCoder")
location = locator.geocode(city)
print(location)## keep latitude and longitude only
location = [location.latitude, location.longitude]
print("[lat, long]:", location)
I am going to create the map with folium, a really convenient package that allows us to plot interactive maps without needing to load a shapefile. Each store shall be identified by a point with size proportional to its current staff and color based on its cost. I’m also going to add a small piece of HTML code to the default map to display the legend.
我将使用folium创建地图,这是一个非常方便的程序包,它使我们能够绘制交互式地图而无需加载shapefile 。 每个商店都应通过一个点来标识,该点的大小与其当前员工人数成正比,并根据其成本来区分颜色。 我还将在默认地图中添加一小段HTML代码以显示图例。
x, y = "Latitude", "Longitude"
color = "Cost"size = "Staff"popup = "Street Address"
data = dtf.copy()
## create color column
lst_colors=["red","green","orange"]
lst_elements = sorted(list(dtf[color].unique()))
data["color"] = data[color].apply(lambda x:
lst_colors[lst_elements.index(x)])## create size column (scaled)
scaler = preprocessing.MinMaxScaler(feature_range=(3,15))
data["size"] = scaler.fit_transform(
data[size].values.reshape(-1,1)).reshape(-1)
## initialize the map with the starting locationmap_ = folium.Map(location=location, tiles="cartodbpositron",
zoom_start=11)## add points
data.apply(lambda row: folium.CircleMarker(
location=[row[x],row[y]], popup=row[popup],
color=row["color"], fill=True,
radius=row["size"]).add_to(map_), axis=1)## add html legendlegend_html = """<div style="position:fixed; bottom:10px; left:10px; border:2px solid black; z-index:9999; font-size:14px;"> <b>"""+color+""":</b><br>"""
for i in lst_elements:
legend_html = legend_html+""" <i class="fa fa-circle
fa-1x" style="color:"""+lst_colors[lst_elements.index(i)]+"""">
</i> """+str(i)+"""<br>"""
legend_html = legend_html+"""</div>"""map_.get_root().html.add_child(folium.Element(legend_html))
## plot the map
map_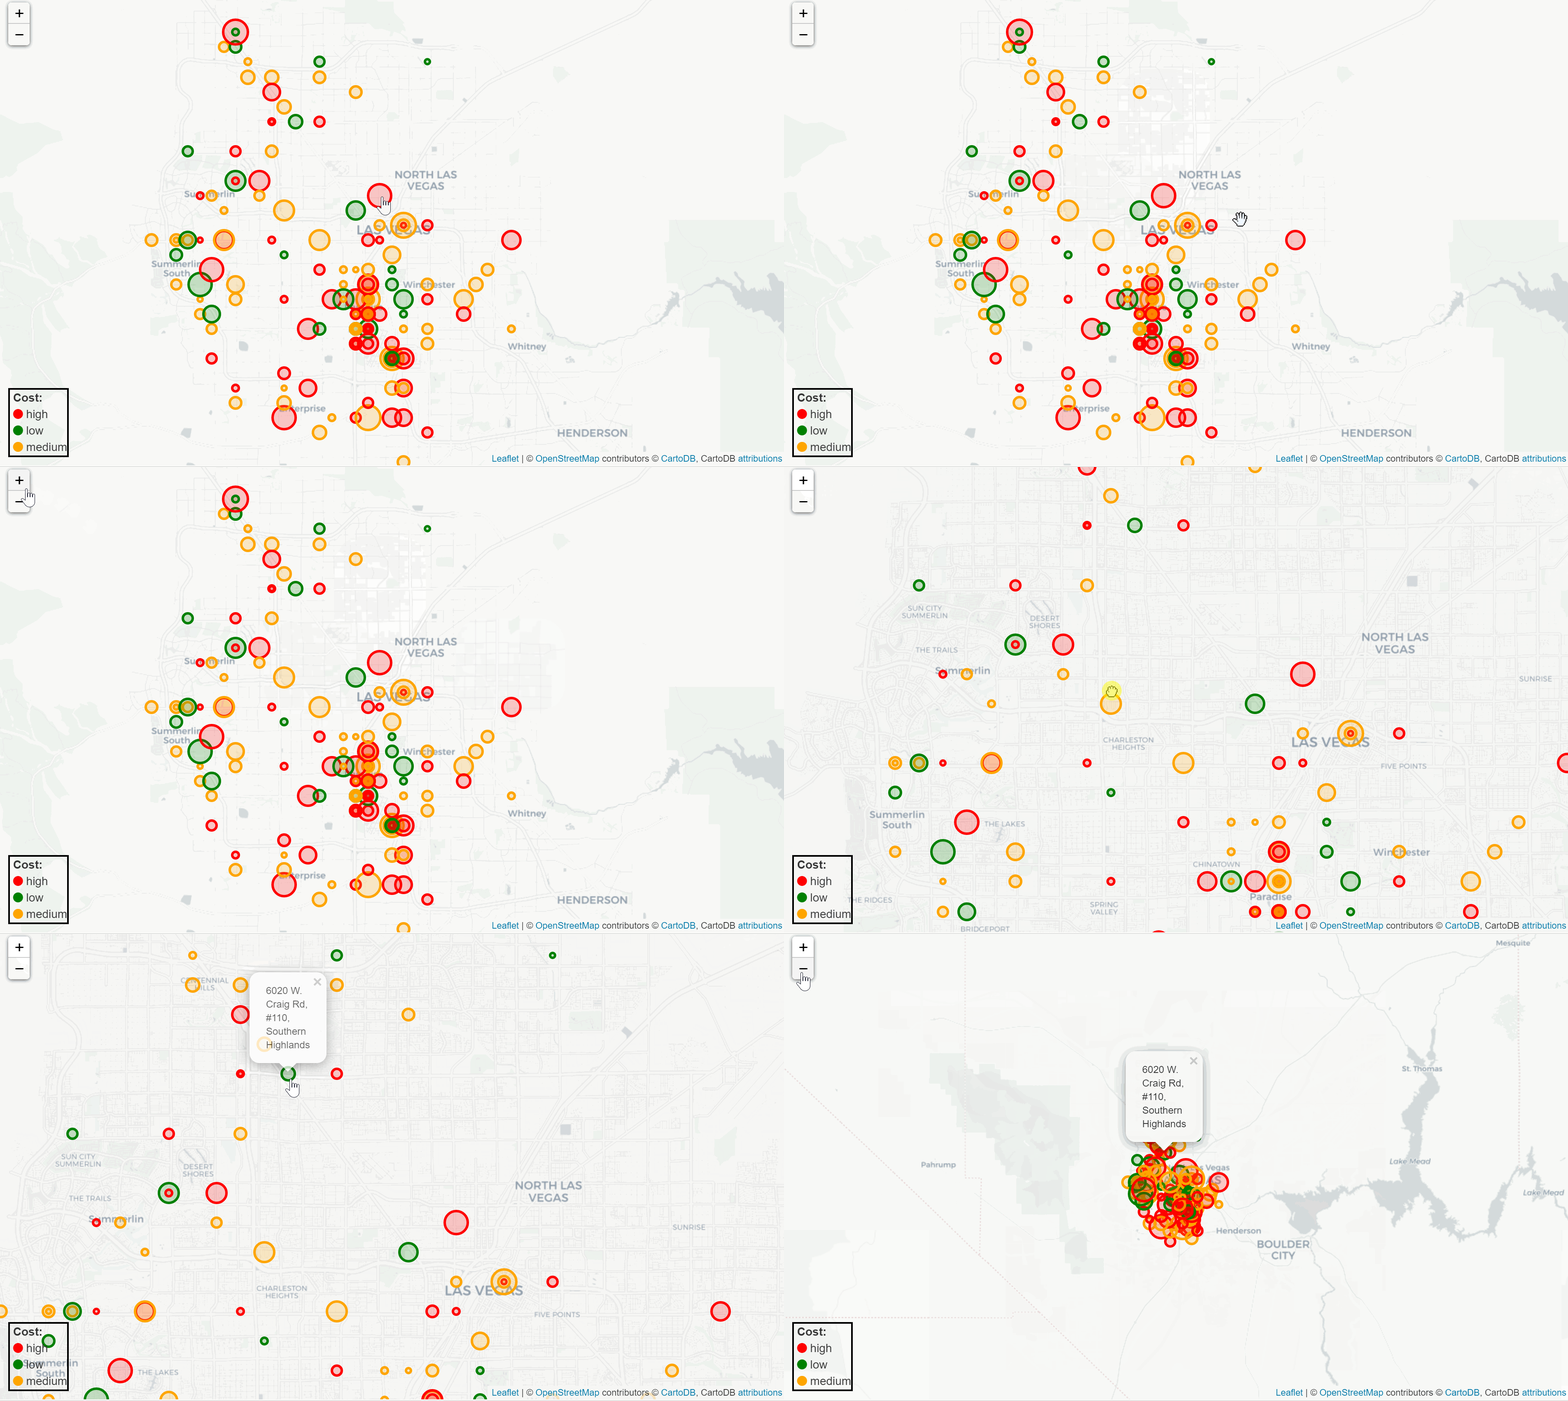
Our objective is to close as many high-cost stores (red points) as possible by moving their staff into low-cost stores (green points) with capacity located in the same neighborhood. As a result, we’ll maximize profit (by closing high-cost stores) and efficiency (by having low-cost stores working at full capacity).
我们的目标是通过将员工转移到容量相同的低成本商店(绿点)中来关闭尽可能多的高成本商店(红点)。 结果,我们将最大化利润(通过关闭高成本商店)和效率(通过使低成本商店满负荷运转)。
How can we define neighborhoods without selecting distance thresholds and geographic boundaries? Well, the answer is … Clustering.
我们如何在不选择距离阈值和地理边界的情况下定义邻域? 好吧,答案是…群集。
聚类 (Clustering)
There are several algorithms that can be used, the main ones are listed here. I will try K-Means, Affinity Propagation, Self Organizing Map.
可以使用几种算法, 此处列出了主要算法。 我将尝试K-均值,亲和传播,自组织映射。
K-Means aims to partition the observations into a predefined number of clusters (k) in which each point belongs to the cluster with the nearest mean. It starts by randomly selecting k centroids and assigning the points to the closest cluster, then it updates each centroid with the mean of all points in the cluster. This algorithm is convenient when you need the get a precise number of groups (e.g. to keep a minimum number of operating stores), and it’s more appropriate for a small number of even clusters.
K-Means旨在将观察结果划分为预定义数量的聚类( k ),其中每个点均属于具有最均值的聚类。 首先从随机选择k个质心并将点分配给最近的聚类开始,然后使用聚类中所有点的平均值更新每个质心。 当您需要获取精确数量的组(例如,保持最少数量的运营商店)时,此算法非常方便,它更适合少数偶数集群。
Here, in order to define the right k, I shall use the Elbow Method: plotting the variance as a function of the number of clusters and picking the k that flats the curve.
在这里,为了定义正确的k,我将使用Elbow方法 :绘制方差作为簇数的函数,并选择使曲线平坦的k 。
X = dtf[["Latitude","Longitude"]]max_k = 10## iterations
distortions = []
for i in range(1, max_k+1):
    if len(X) >= i:
       model = cluster.KMeans(n_clusters=i, init='k-means++', max_iter=300, n_init=10, random_state=0)
       model.fit(X)
       distortions.append(model.inertia_)## best k: the lowest derivative
k = [i*100 for i in np.diff(distortions,2)].index(min([i*100 for i
     in np.diff(distortions,2)]))## plot
fig, ax = plt.subplots()
ax.plot(range(1, len(distortions)+1), distortions)
ax.axvline(k, ls='--', color="red", label="k = "+str(k))
ax.set(title='The Elbow Method', xlabel='Number of clusters',
       ylabel="Distortion")
ax.legend()
ax.grid(True)
plt.show()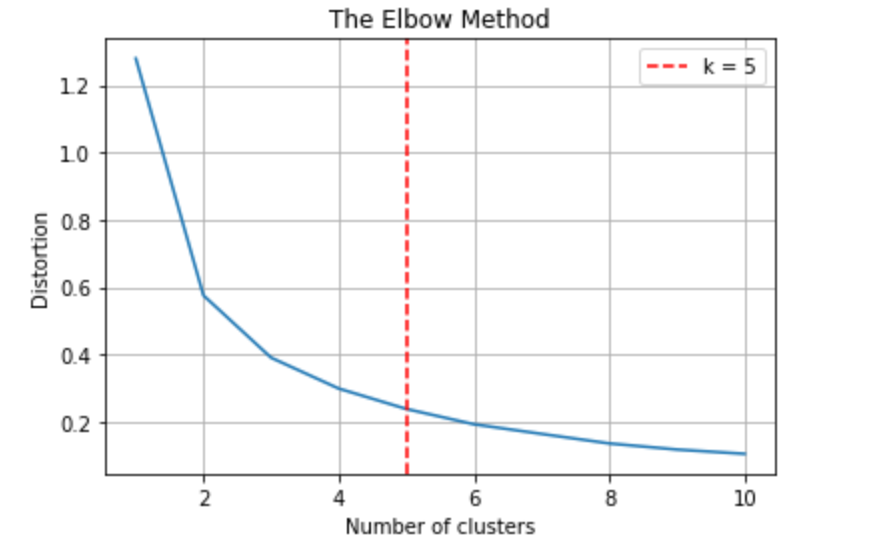
We can try with k = 5 so that the K-Means algorithm will find 5 theoretical centroids. In addition, I will identify the real centroids too (the closest observation to the cluster center).
我们可以尝试使用k = 5,以便K-Means算法将找到5个理论质心。 此外,我还将识别真实的质心(最接近聚类中心的观测值)。
k = 5
model = cluster.KMeans(n_clusters=k, init='k-means++')
X = dtf[["Latitude","Longitude"]]## clustering
dtf_X = X.copy()
dtf_X["cluster"] = model.fit_predict(X)## find real centroids
closest, distances = scipy.cluster.vq.vq(model.cluster_centers_,
                     dtf_X.drop("cluster", axis=1).values)
dtf_X["centroids"] = 0
for i in closest:
    dtf_X["centroids"].iloc[i] = 1## add clustering info to the original datasetdtf[["cluster","centroids"]] = dtf_X[["cluster","centroids"]]
dtf.sample(5)
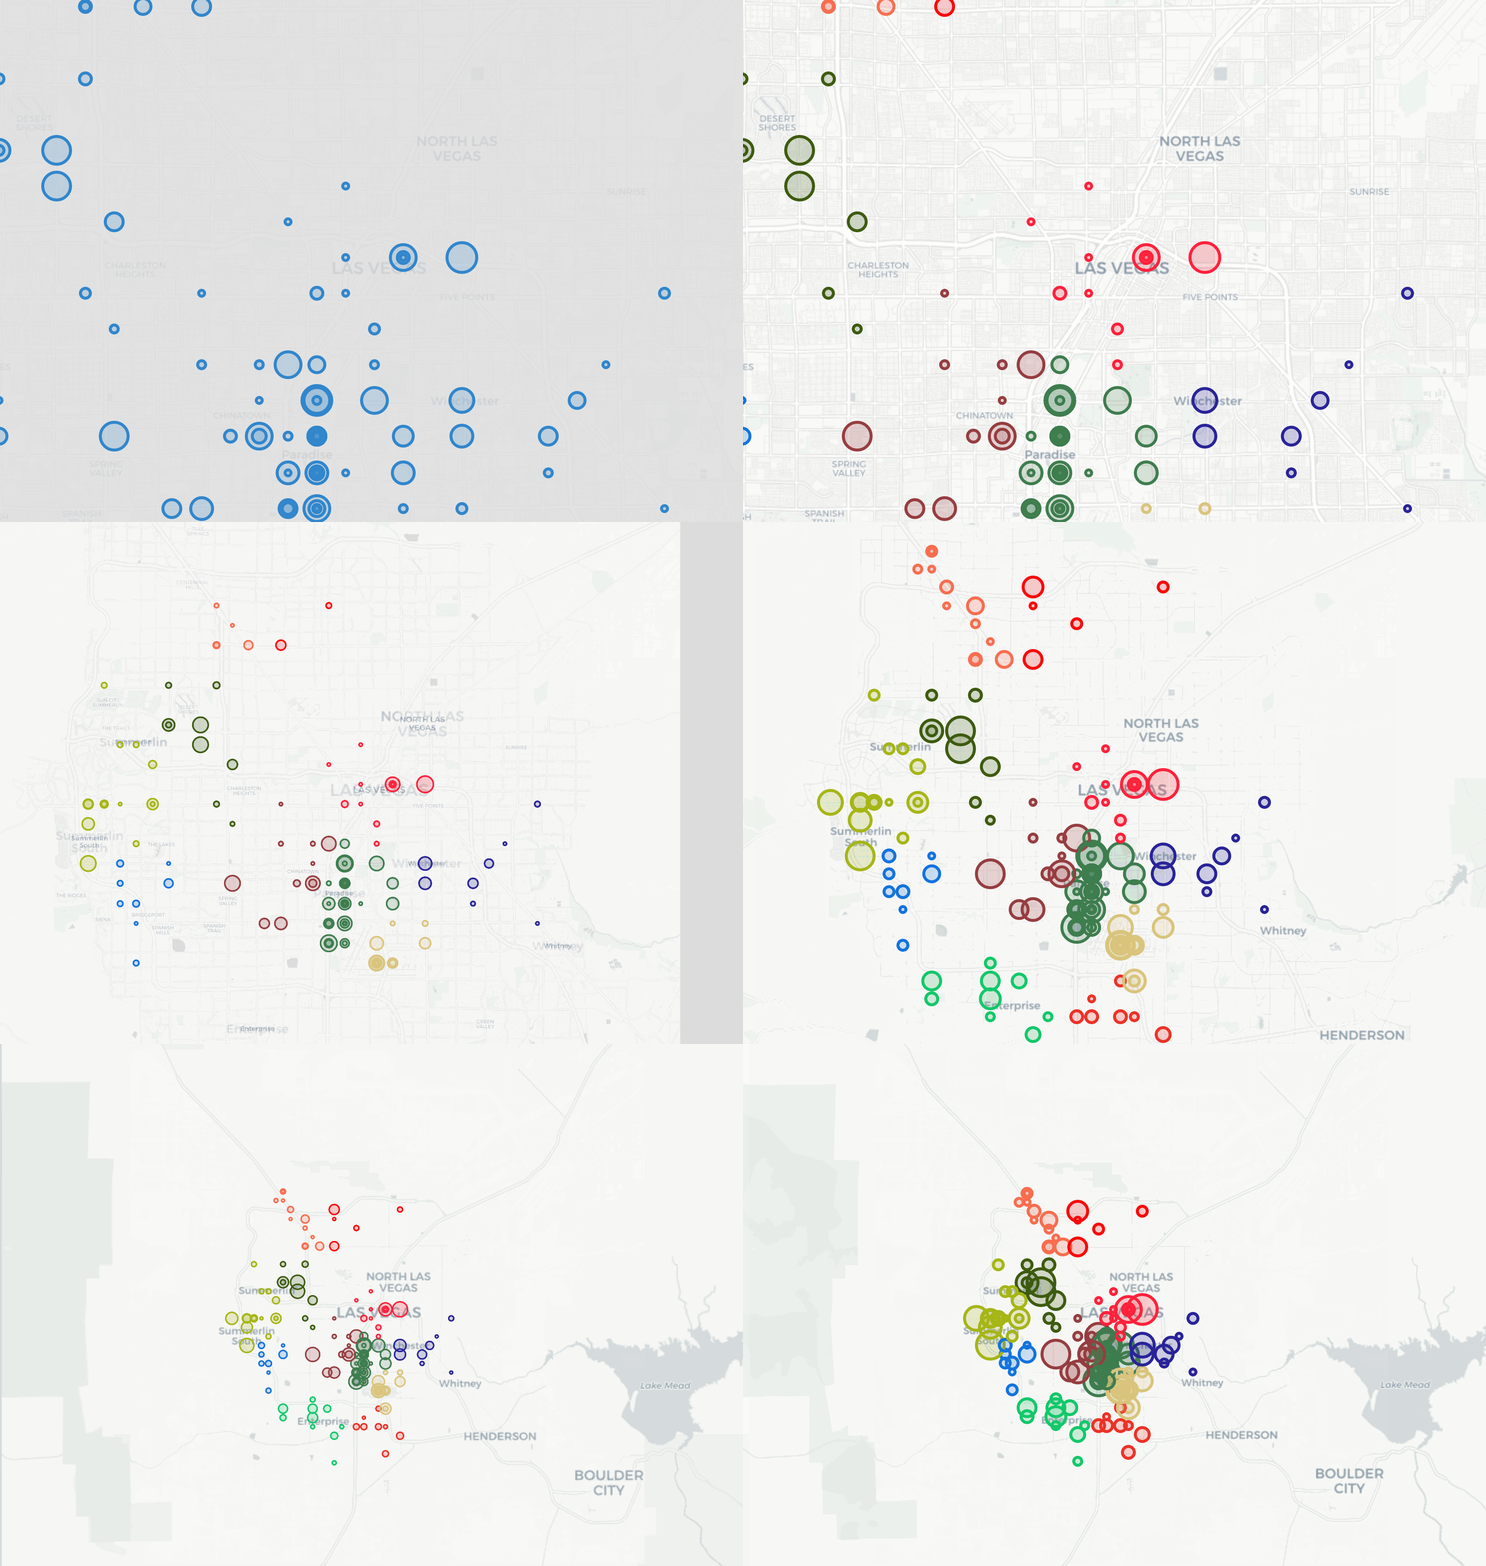
I added two columns to the dataset: “cluster” indicating what cluster the observation belongs to, and “centroids” that is 1 if an observation is also the centroid (the closest to the center) and 0 otherwise. Let’s plot it out:
我在数据集中添加了两列:“ cluster ”,指示观察值所属的聚类;“ centroids ”,如果观察值也是质心(最靠近中心),则为1;否则为0。 让我们把它画出来:
## plot
fig, ax = plt.subplots()
sns.scatterplot(x="Latitude", y="Longitude", data=dtf,
                palette=sns.color_palette("bright",k),
                hue='cluster', size="centroids", size_order=[1,0],
                legend="brief", ax=ax).set_title('Clustering
                (k='+str(k)+')')th_centroids = model.cluster_centers_
ax.scatter(th_centroids[:,0], th_centroids[:,1], s=50, c='black',
           marker="x")
Affinity Propagation is a graph-based algorithm that assigns each observation to its nearest exemplar. Basically, all the observations “vote” for which other observations they want to be associated with, which results in a partitioning of the whole dataset into a large number of uneven clusters. It’s quite convenient when you can’t specify the number of clusters, and it’s suited for geospatial data as it works well with non-flat geometry.
相似性传播是一种基于图的算法,可将每个观察值分配给最接近的示例。 基本上,所有观察都“投票”与它们想要关联的其他观察,这导致整个数据集被划分为大量不均匀的簇。 当您无法指定簇数时,这非常方便,并且它适用于地理空间数据,因为它适用于非平面几何。
model = cluster.AffinityPropagation()Using the same code from before, you can fit the model (finds 12 clusters), and you can use the following code to plot (the difference is that k wasn’t declared at the beginning and there are no theoretical centroids):
使用与之前相同的代码,可以拟合模型(找到12个聚类),并且可以使用以下代码进行绘图(不同之处在于,开头没有声明k ,并且没有理论上的质心):
k = dtf["cluster"].nunique()sns.scatterplot(x="Latitude", y="Longitude", data=dtf,
                palette=sns.color_palette("bright",k),
                hue='cluster', size="centroids", size_order=[1,0],
                legend="brief").set_title('Clustering
                (k='+str(k)+')')
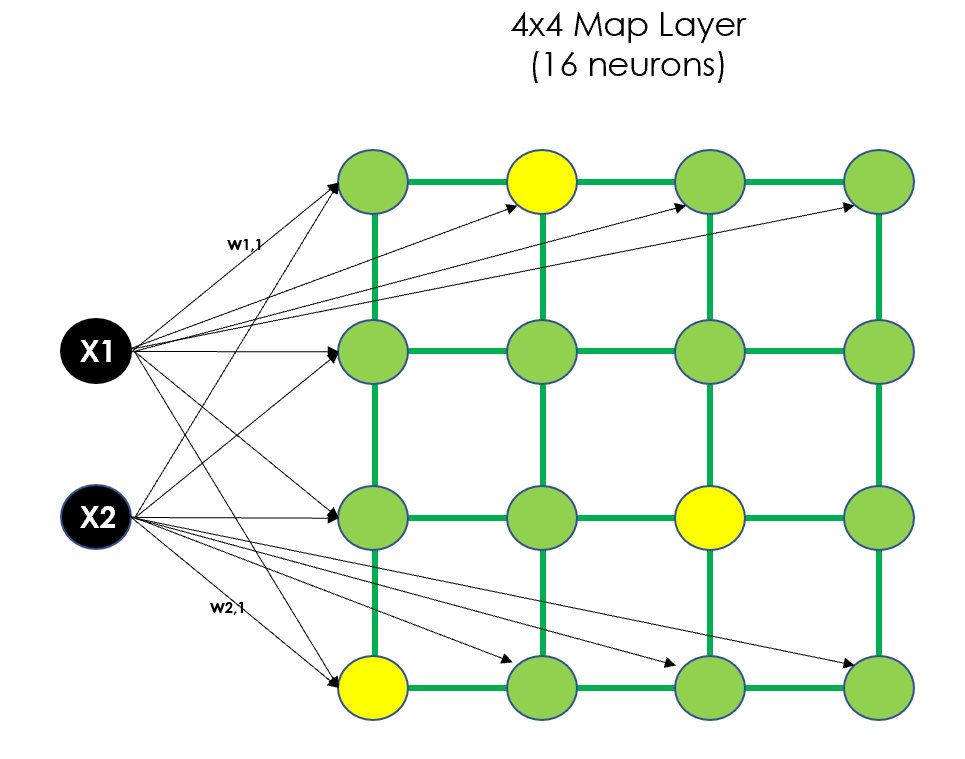
Self Organizing Maps (SOMs) are quite different as they use deep learning. In fact, A SOM is a type of artificial neural network that is trained using unsupervised learning to produce a low-dimensional representation of the input space, called a “map” (also referred to as Kohonen layer). Basically, inputs are connected to n x m neurons which form the map, then for every observation is calculated the “winning” neuron (the closest), and neurons are clustered together using the lateral distance. Here, I will try with a 4x4 SOM:
自组织地图 (SOM)使用深度学习的方式完全不同。 实际上,SOM是一种人工神经网络,使用无监督学习对其进行训练,以生成输入空间的低维表示形式,称为“地图”(也称为Kohonen层 )。 基本上,将输入连接到形成地图的nxm个神经元,然后针对每个观察值计算“获胜”神经元(最近的),并使用横向距离将神经元聚在一起。 在这里,我将尝试使用4x4 SOM:
X = dtf[["Latitude","Longitude"]]
map_shape = (4,4)## scale data
scaler = preprocessing.StandardScaler()
X_preprocessed = scaler.fit_transform(X.values)## clusteringmodel = minisom.MiniSom(x=map_shape[0], y=map_shape[1],
                        input_len=X.shape[1])
model.train_batch(X_preprocessed, num_iteration=100, verbose=False)## build output dataframe
dtf_X = X.copy()
dtf_X["cluster"] = np.ravel_multi_index(np.array(
      [model.winner(x) for x in X_preprocessed]).T, dims=map_shape)## find real centroidscluster_centers = np.array([vec for center in model.get_weights()
                            for vec in center])closest, distances = scipy.cluster.vq.vq(model.cluster_centers_,
                                         X_preprocessed)
dtf_X["centroids"] = 0
for i in closest:
    dtf_X["centroids"].iloc[i] = 1## add clustering info to the original datasetdtf[["cluster","centroids"]] = dtf_X[["cluster","centroids"]]## plotk = dtf["cluster"].nunique()fig, ax = plt.subplots()
sns.scatterplot(x="Latitude", y="Longitude", data=dtf,
                palette=sns.color_palette("bright",k),
                hue='cluster', size="centroids", size_order=[1,0],
                legend="brief", ax=ax).set_title('Clustering
                (k='+str(k)+')')th_centroids = scaler.inverse_transform(cluster_centers)
ax.scatter(th_centroids[:,0], th_centroids[:,1], s=50, c='black',
           marker="x")
Independently from the algorithm you used to cluster the data, now you have a dataset with two more columns (“cluster”, “centroids”). We can use that to visualize the clusters on the map, and this time I’m going to display the centroids as well using a marker.
独立于用于对数据进行聚类的算法,现在您有了一个包含两列(“ 聚类 ”,“ 质心 ”)的数据集。 我们可以使用它来可视化地图上的聚类,这一次,我还将使用标记显示质心。
x, y = "Latitude", "Longitude"
color = "cluster"size = "Staff"popup = "Street Address"marker = "centroids"
data = dtf.copy()## create color column
lst_elements = sorted(list(dtf[color].unique()))
lst_colors = ['#%06X' % np.random.randint(0, 0xFFFFFF) for i in
range(len(lst_elements))]
data["color"] = data[color].apply(lambda x:
lst_colors[lst_elements.index(x)])## create size column (scaled)
scaler = preprocessing.MinMaxScaler(feature_range=(3,15))
data["size"] = scaler.fit_transform(
data[size].values.reshape(-1,1)).reshape(-1)## initialize the map with the starting locationmap_ = folium.Map(location=location, tiles="cartodbpositron",
zoom_start=11)## add points
data.apply(lambda row: folium.CircleMarker(
location=[row[x],row[y]], popup=row[popup],
color=row["color"], fill=True,
radius=row["size"]).add_to(map_), axis=1)## add html legendlegend_html = """<div style="position:fixed; bottom:10px; left:10px; border:2px solid black; z-index:9999; font-size:14px;"> <b>"""+color+""":</b><br>"""
for i in lst_elements:
legend_html = legend_html+""" <i class="fa fa-circle
fa-1x" style="color:"""+lst_colors[lst_elements.index(i)]+"""">
</i> """+str(i)+"""<br>"""
legend_html = legend_html+"""</div>"""map_.get_root().html.add_child(folium.Element(legend_html))## add centroids marker
lst_elements = sorted(list(dtf[marker].unique()))
data[data[marker]==1].apply(lambda row:
folium.Marker(location=[row[x],row[y]],
popup=row[marker], draggable=False,
icon=folium.Icon(color="black")).add_to(map_), axis=1)## plot the map
map_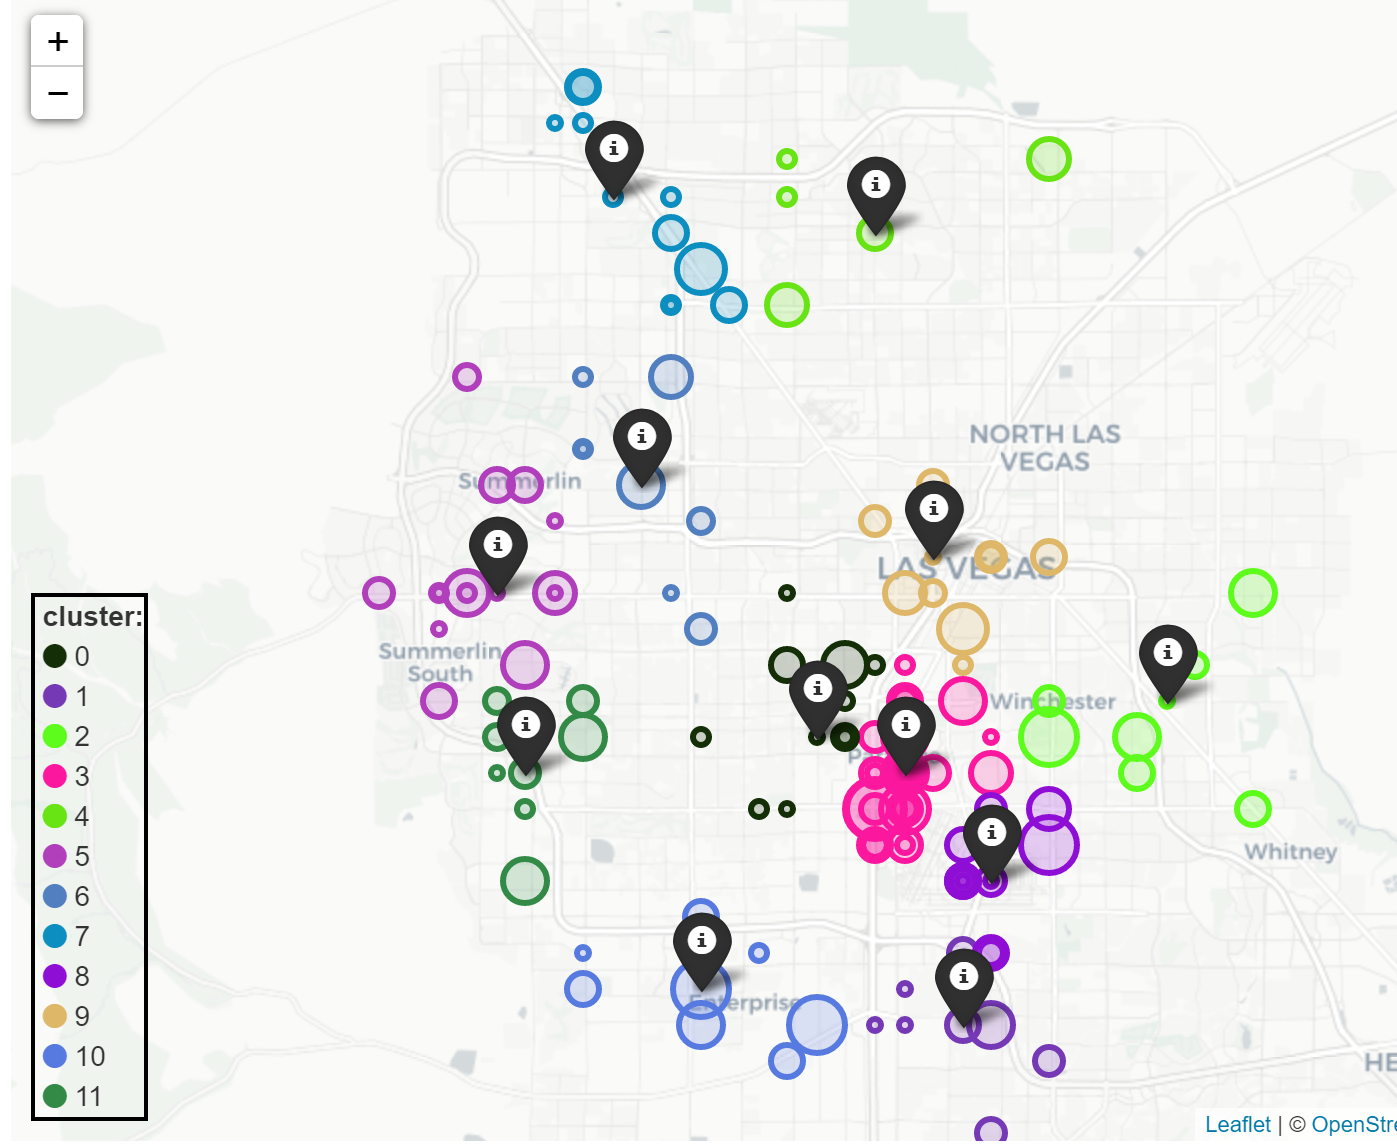
Now that we have the clusters, we can start the store rationalization inside each of them.
现在我们有了集群,我们可以在每个集群内部开始商店合理化。
商店合理化 (Store Rationalization)
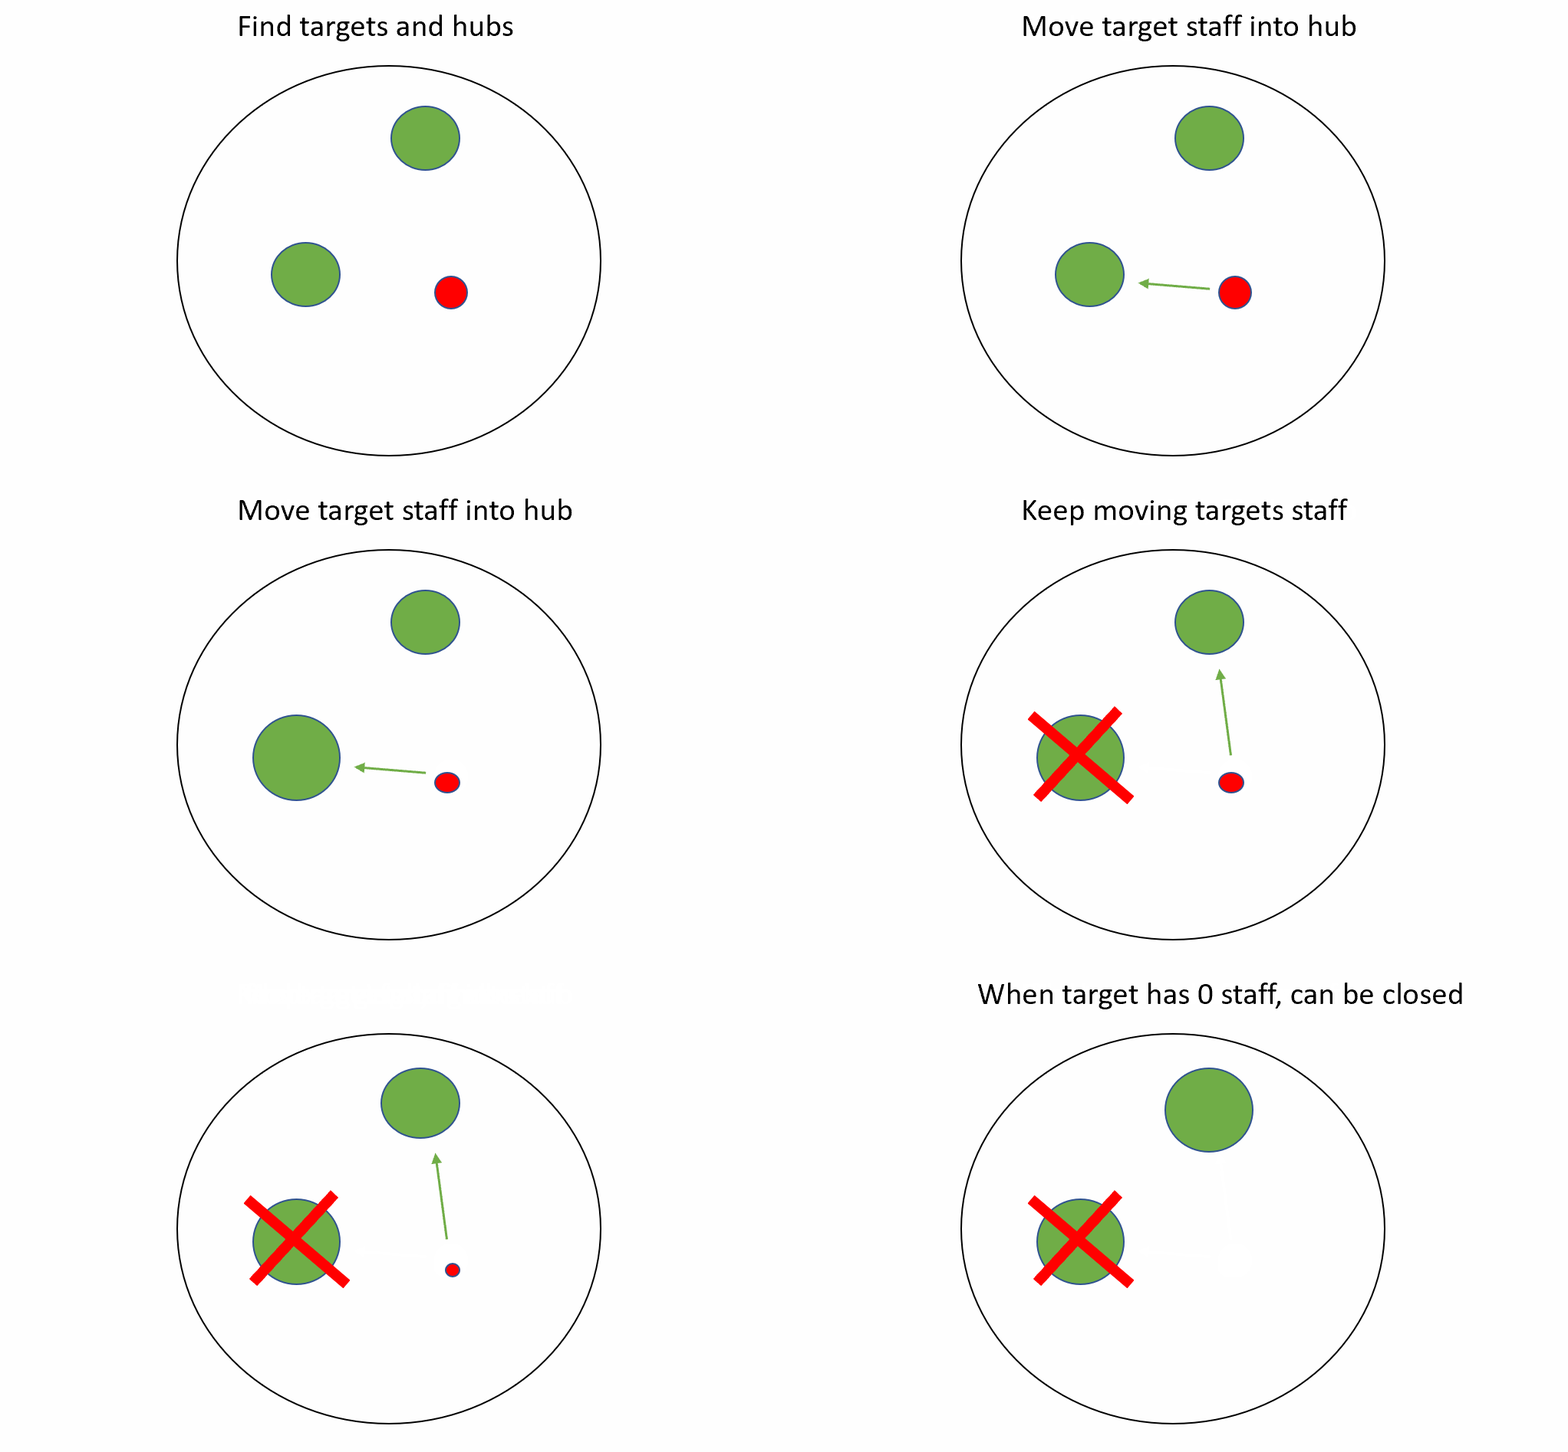
Since the main focus of this article is clustering geospatial data, I will keep this section very simple. Inside each cluster, I will select the potential targets (high-cost stores) and hubs (low-cost stores), and relocate the staff of the targets in the hubs until the latter reach full capacity. When the whole staff of a target is moved, the store can be closed.
由于本文的主要重点是对地理空间数据进行聚类,因此我将使本节非常简单。 在每个集群内部,我将选择潜在目标(高成本商店)和中心(低成本商店),并在中心达到目标容量之前重新定位目标人员。 当目标的整个人员移动时,可以关闭商店。
dtf_new = pd.DataFrame()for c in sorted(dtf["cluster"].unique()):
    dtf_cluster = dtf[dtf["cluster"]==c]

    ## hubs and targets
    lst_hubs = dtf_cluster[dtf_cluster["Cost"]=="low"
               ].sort_values("Capacity").to_dict("records")
    lst_targets = dtf_cluster[dtf_cluster["Cost"]=="high"
               ].sort_values("Staff").to_dict("records")    ## move targets
    for target in lst_targets:
         for hub in lst_hubs:
             ### if hub has space
             if hub["Capacity"] > 0:
                residuals = hub["Capacity"] - target["Staff"]                #### case of hub has still capacity: do next target
                if residuals >= 0:
                   hub["Staff"] += target["Staff"]
                   hub["Capacity"] = hub["Potential"] - hub["Staff"]
                   target["Capacity"] = target["Potential"]
                   target["Staff"] = 0
                   break                #### case of hub is full: do next hub
                else:
                   hub["Capacity"] = 0
                   hub["Staff"] = hub["Potential"]
                   target["Staff"] = -residuals
                   target["Capacity"] = target["Potential"] -
                                          target["Staff"]    dtf_new = dtf_new.append(pd.DataFrame(lst_hubs)
                 ).append(pd.DataFrame(lst_targets))dtf_new = dtf_new.append(dtf[dtf["Cost"]=="medium"]
                 ).reset_index(drop=True).sort_values(
                 ["cluster","Staff"])
dtf_new.head()
This is a really simple algorithm that can be improved in several ways: for example, by taking the medium-cost stores into the equation and replicate the process when the low-cost ones are all full.
这是一个非常简单的算法,可以通过几种方式进行改进:例如,通过将中等成本的存储纳入等式,并在所有低成本存储都已满时复制该过程。
Let’s see how many high-cost stores we closed with this basic process:
让我们看看通过此基本流程关闭了多少家高价商店:
dtf_new["closed"] = dtf_new["Staff"].apply(lambda x: 1
                                           if x==0 else 0)
print("closed:", dtf_new["closed"].sum())
We managed to close 19 stores, but did we also maintained a homogeneous coverage of the area so that customers won’t need to go to another neighborhood to visit a store? Let’s visualize the aftermath on the map by marking out the closed stores (marker = “closed”):
我们设法关闭了19家商店,但我们是否也对该地区进行了统一覆盖,这样客户就不必去另一个街区去逛商店了? 让我们通过标记关闭的商店( marker =“ closed” )来可视化地图上的后果:

结论 (Conclusion)
This article has been a tutorial about how to use Clustering and Geospatial Analysis for a retail business case. I used a simulated dataset to compare popular Machine Learning and Deep Learning approaches and showed how to plot the output on interactive maps. I also showed a simple deterministic algorithm to provide a solution to the business case.
本文是有关如何在零售业务案例中使用聚类和地理空间分析的教程。 我使用模拟数据集比较了流行的机器学习和深度学习方法,并展示了如何在交互式地图上绘制输出。 我还展示了一种简单的确定性算法,可以为业务案例提供解决方案。
翻译自: https://towardsdatascience.com/clustering-geospatial-data-f0584f0b04ec
本文来自互联网用户投稿,该文观点仅代表作者本人,不代表本站立场。本站仅提供信息存储空间服务,不拥有所有权,不承担相关法律责任。如若转载,请注明出处:http://www.mzph.cn/news/242140.shtml
如若内容造成侵权/违法违规/事实不符,请联系多彩编程网进行投诉反馈email:809451989@qq.com,一经查实,立即删除!


中的变量选择)


)


