import numpy as np
import pandas as pd
import matplotlib.pyplot as plt
import seaborn as sns
In [2]:
data=pd.read_csv(r'../教师文件/air_data.csv')
In [3]:
data.head()
Out[3]:
| Start_time | End_time | Fare | City | Age | Flight_count | Avg_discount | Flight_mileage | |
|---|---|---|---|---|---|---|---|---|
| 0 | 2011/08/18 | 2014/03/31 | 5860.0 | . | 35.0 | 10 | 0.973129 | 12560 |
| 1 | 2011/01/13 | 2014/03/31 | 5561.0 | 佛山 | 35.0 | 12 | 0.575906 | 21223 |
| 2 | 2012/08/15 | 2014/03/31 | 1089.0 | 北京 | 33.0 | 9 | 0.635025 | 19246 |
| 3 | 2012/10/17 | 2014/03/31 | 9626.0 | 绍兴县 | 53.0 | 7 | 0.868571 | 14070 |
| 4 | 2011/09/04 | 2014/03/31 | 4473.0 | 上海 | 34.0 | 13 | 0.703419 | 17373 |
In [4]:
data.info()
<class 'pandas.core.frame.DataFrame'>
RangeIndex: 15000 entries, 0 to 14999
Data columns (total 8 columns):#   Column          Non-Null Count  Dtype
---  ------          --------------  -----  0   Start_time      15000 non-null  object 1   End_time        15000 non-null  object 2   Fare            14989 non-null  float643   City            14490 non-null  object 4   Age             14907 non-null  float645   Flight_count    15000 non-null  int64  6   Avg_discount    15000 non-null  float647   Flight_mileage  15000 non-null  int64
dtypes: float64(3), int64(2), object(3)
memory usage: 937.6+ KB
In [5]:
data.describe()
Out[5]:
| Fare | Age | Flight_count | Avg_discount | Flight_mileage | |
|---|---|---|---|---|---|
| count | 14989.000000 | 14907.000000 | 15000.000000 | 15000.000000 | 15000.000000 |
| mean | 3761.743812 | 42.569531 | 9.057600 | 0.728391 | 12395.706800 |
| std | 2720.206579 | 9.807385 | 3.946338 | 0.163550 | 3588.357291 |
| min | 0.000000 | 16.000000 | 2.000000 | 0.136017 | 4040.000000 |
| 25% | 1709.000000 | 35.000000 | 6.000000 | 0.625525 | 9747.000000 |
| 50% | 3580.000000 | 41.000000 | 8.000000 | 0.713322 | 11986.500000 |
| 75% | 5452.000000 | 48.000000 | 11.000000 | 0.803840 | 14654.000000 |
| max | 36602.000000 | 110.000000 | 47.000000 | 1.500000 | 50758.000000 |
In [6]:
data=data[data.Fare.notnull()]
In [7]:
data=data[data.Fare!=0]
In [8]:
for index,item in data.iterrows():s_year,s_month=item['Start_time'].split('/')[:2]e_year,e_month=item['End_time'].split('/')[:2]data.loc[index,'Months']=(int(e_year)-int(s_year))*12+(int(e_month)-int(s_month))
data=data.drop(['Start_time','End_time'],axis=1)
In [9]:
data.info()
<class 'pandas.core.frame.DataFrame'>
Int64Index: 13279 entries, 0 to 14998
Data columns (total 7 columns):#   Column          Non-Null Count  Dtype
---  ------          --------------  -----  0   Fare            13279 non-null  float641   City            12809 non-null  object 2   Age             13199 non-null  float643   Flight_count    13279 non-null  int64  4   Avg_discount    13279 non-null  float645   Flight_mileage  13279 non-null  int64  6   Months          13279 non-null  float64
dtypes: float64(4), int64(2), object(1)
memory usage: 1.3+ MB
In [10]:
data=data.drop(['City'],axis=1)
data=(data-data.mean(axis=0))/data.std(axis=0)
In [11]:
data.head()
Out[11]:
| Fare | Age | Flight_count | Avg_discount | Flight_mileage | Months | |
|---|---|---|---|---|---|---|
| 0 | 0.643204 | -0.781959 | 0.191752 | 1.539425 | 0.019051 | -0.616333 |
| 1 | 0.524036 | -0.781959 | 0.700041 | -0.935625 | 2.427818 | -0.357005 |
| 2 | -1.258303 | -0.985351 | -0.062393 | -0.567261 | 1.878109 | -1.060895 |
| 3 | 2.144162 | 1.048561 | -0.570681 | 0.887939 | 0.438910 | -1.134989 |
| 4 | 0.090408 | -0.883655 | 0.954185 | -0.141105 | 1.357317 | -0.653379 |
In [12]:
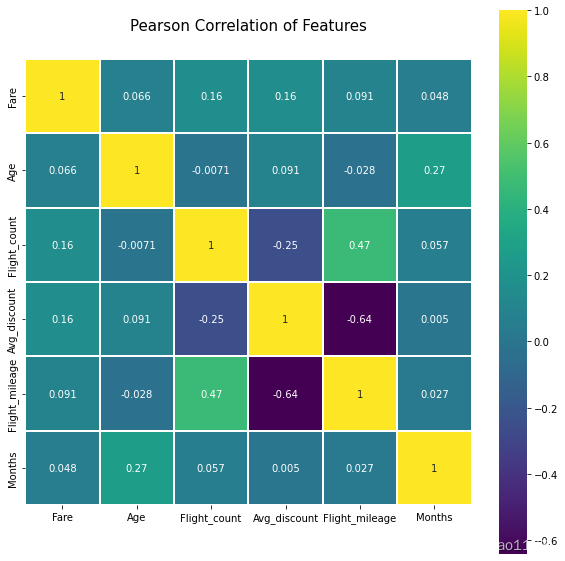
plt.figure(figsize=(10,10))
plt.title("Pearson Correlation of Features",y=1.05,size=15)
sns.heatmap(data.astype(float).corr(),linewidths=0.1,vmax=1,square=True,cmap=plt.cm.viridis,linecolor='white',annot=True)
Out[12]:
<AxesSubplot:title={'center':'Pearson Correlation of Features'}>

In [13]:
data=data.drop(['Fare','Age'],axis=1)
In [14]:
from sklearn.cluster import KMeans
In [15]:
kmeans=KMeans(n_clusters=3).fit(data)
In [16]:
kmeans.cluster_centers_
Out[16]:
array([[-0.56475974, 0.54131875, -0.70701626, -0.56628176],[-0.06513412, -0.03376272, -0.10437466, 1.24214471],[ 0.75090493, -0.63663316, 0.95977635, -0.37662422]])
In [17]:
kmeans.labels_
Out[17]:
array([0, 2, 2, ..., 0, 0, 0])
In [18]:
from collections import defaultdict
In [28]:
label_dict=defaultdict(int)
In [29]:
for label in kmeans.labels_:label_dict[label] += 1
In [30]:
label_dict
Out[30]:
defaultdict(int, {0: 5287, 2: 4287, 1: 3705})
In [31]:
kmeans.cluster_centers_
Out[31]:
array([[-0.56475974, 0.54131875, -0.70701626, -0.56628176],[-0.06513412, -0.03376272, -0.10437466, 1.24214471],[ 0.75090493, -0.63663316, 0.95977635, -0.37662422]])


操作是什么意思)


)


)
