"""模拟退火旅行商"""
import random
import numpy as np
import math
import time
import matplotlib.pyplot as plt
plt.rcParams['font.sans-serif'] = ['SimHei']
plt.rcParams['axes.unicode_minus'] = False
location = np.loadtxt('city_location.txt') # 加载数据'''一些关键参数'''
num_city = 30  # 城市总数
initial_t = 100  # 初始温度
lowest_t = 0.001  # 最低温度
iteration = 10000  # 设置迭代次数'''输入两个城市之间的距离'''
def distance_mat():distance = [] # 初始化距离数组for i in range(30):distance_each = [] # 初始化每个城市到其他城市的距离for j in range(30):dis = math.sqrt(pow(location[i][0] - location[j][0], 2) +pow(location[i][1] - location[j][1], 2)) # 计算距离distance_each.append(dis) # 赋值到distance_each数组distance.append(distance_each) # 按列添加return distance'''计算所有路径对应的距离'''
def cal_newpath(distance, path):# 此时传入的path是一条随机生成的路径dis = 0for j in range(num_city - 1): # 只遍历0到28个城市,是因为第29个城市的下一个是起点,这样才是TSP问题,形成闭环dis = distance[path[j]][path[j + 1]] + dis # 这条路径上经过的两两个点的距离之和即为这条路径的长度dis = dis + distance[path[29]][path[0]]  # 计算的距离之和再加上第28个城市回到起点的距离return dis'''点对点的距离矩阵'''
distance = distance_mat()
'''初始路径'''
path = list(range(30)) # 生成0到29的列表,即城市索引
'''初始距离'''
dis = cal_newpath(distance, path) # 先计算初始的距离,这样在模拟退火的时候才可以开始比较
'''初始温度'''
t_current = initial_t
'''灵敏度分析'''
sensibility = []start_time = time.time() # 开始计时'''模拟退火'''
while t_current > lowest_t:  # 外层循环:改变温度count_m = 0  # M的计数count_iter = 0  # 迭代次数计数while count_iter < iteration:  # 内层循环:连续多次不接受新的状态则跳出内循环i = 0j = 0while i == j:  # 防止随机了同一城市i = random.randint(1, 29)j = random.randint(1, 29)path_new = path.copy()path_new[i], path_new[j] = path_new[j], path_new[i]  # 任意交换两个城市的位置,产生新的路径组合dis_new = cal_newpath(distance, path_new) # 计算新路径的距离dis_delta = dis_new - dis # 计算新距离和旧距离的差值rand = random.random() # 生成一个0到1的浮点随机数exp_d = math.exp(-dis_delta / t_current) # Metropolis准则'''是否接受新解的过程'''if dis_delta < 0: # 如果新距离小于旧距离,则直接接受path = path_newdis = dis_newelif exp_d > rand: # 如果新距离大于旧距离,用Metropolis准则判断是否接受path = path_newdis = dis_newelse: # 不接受新解count_m = count_m + 1count_iter = count_iter + 1 # 迭代次数加1sensibility.append(dis)t_current = 0.99 * t_current  # 改变温度end_time = time.time()
elapsed_time = end_time - start_time# 绘制最短路径的坐标图
x_coords = [location[i][0] for i in path]
y_coords = [location[i][1] for i in path]# 添加起点到终点的连线
x_coords.append(x_coords[0])
y_coords.append(y_coords[0])plt.figure(1)
plt.plot(x_coords, y_coords, marker='o', linestyle='-')
plt.title('最短路径坐标图')
plt.xlabel('X 坐标')
plt.ylabel('Y 坐标')
plt.grid(True)
plt.show()plt.figure(2)
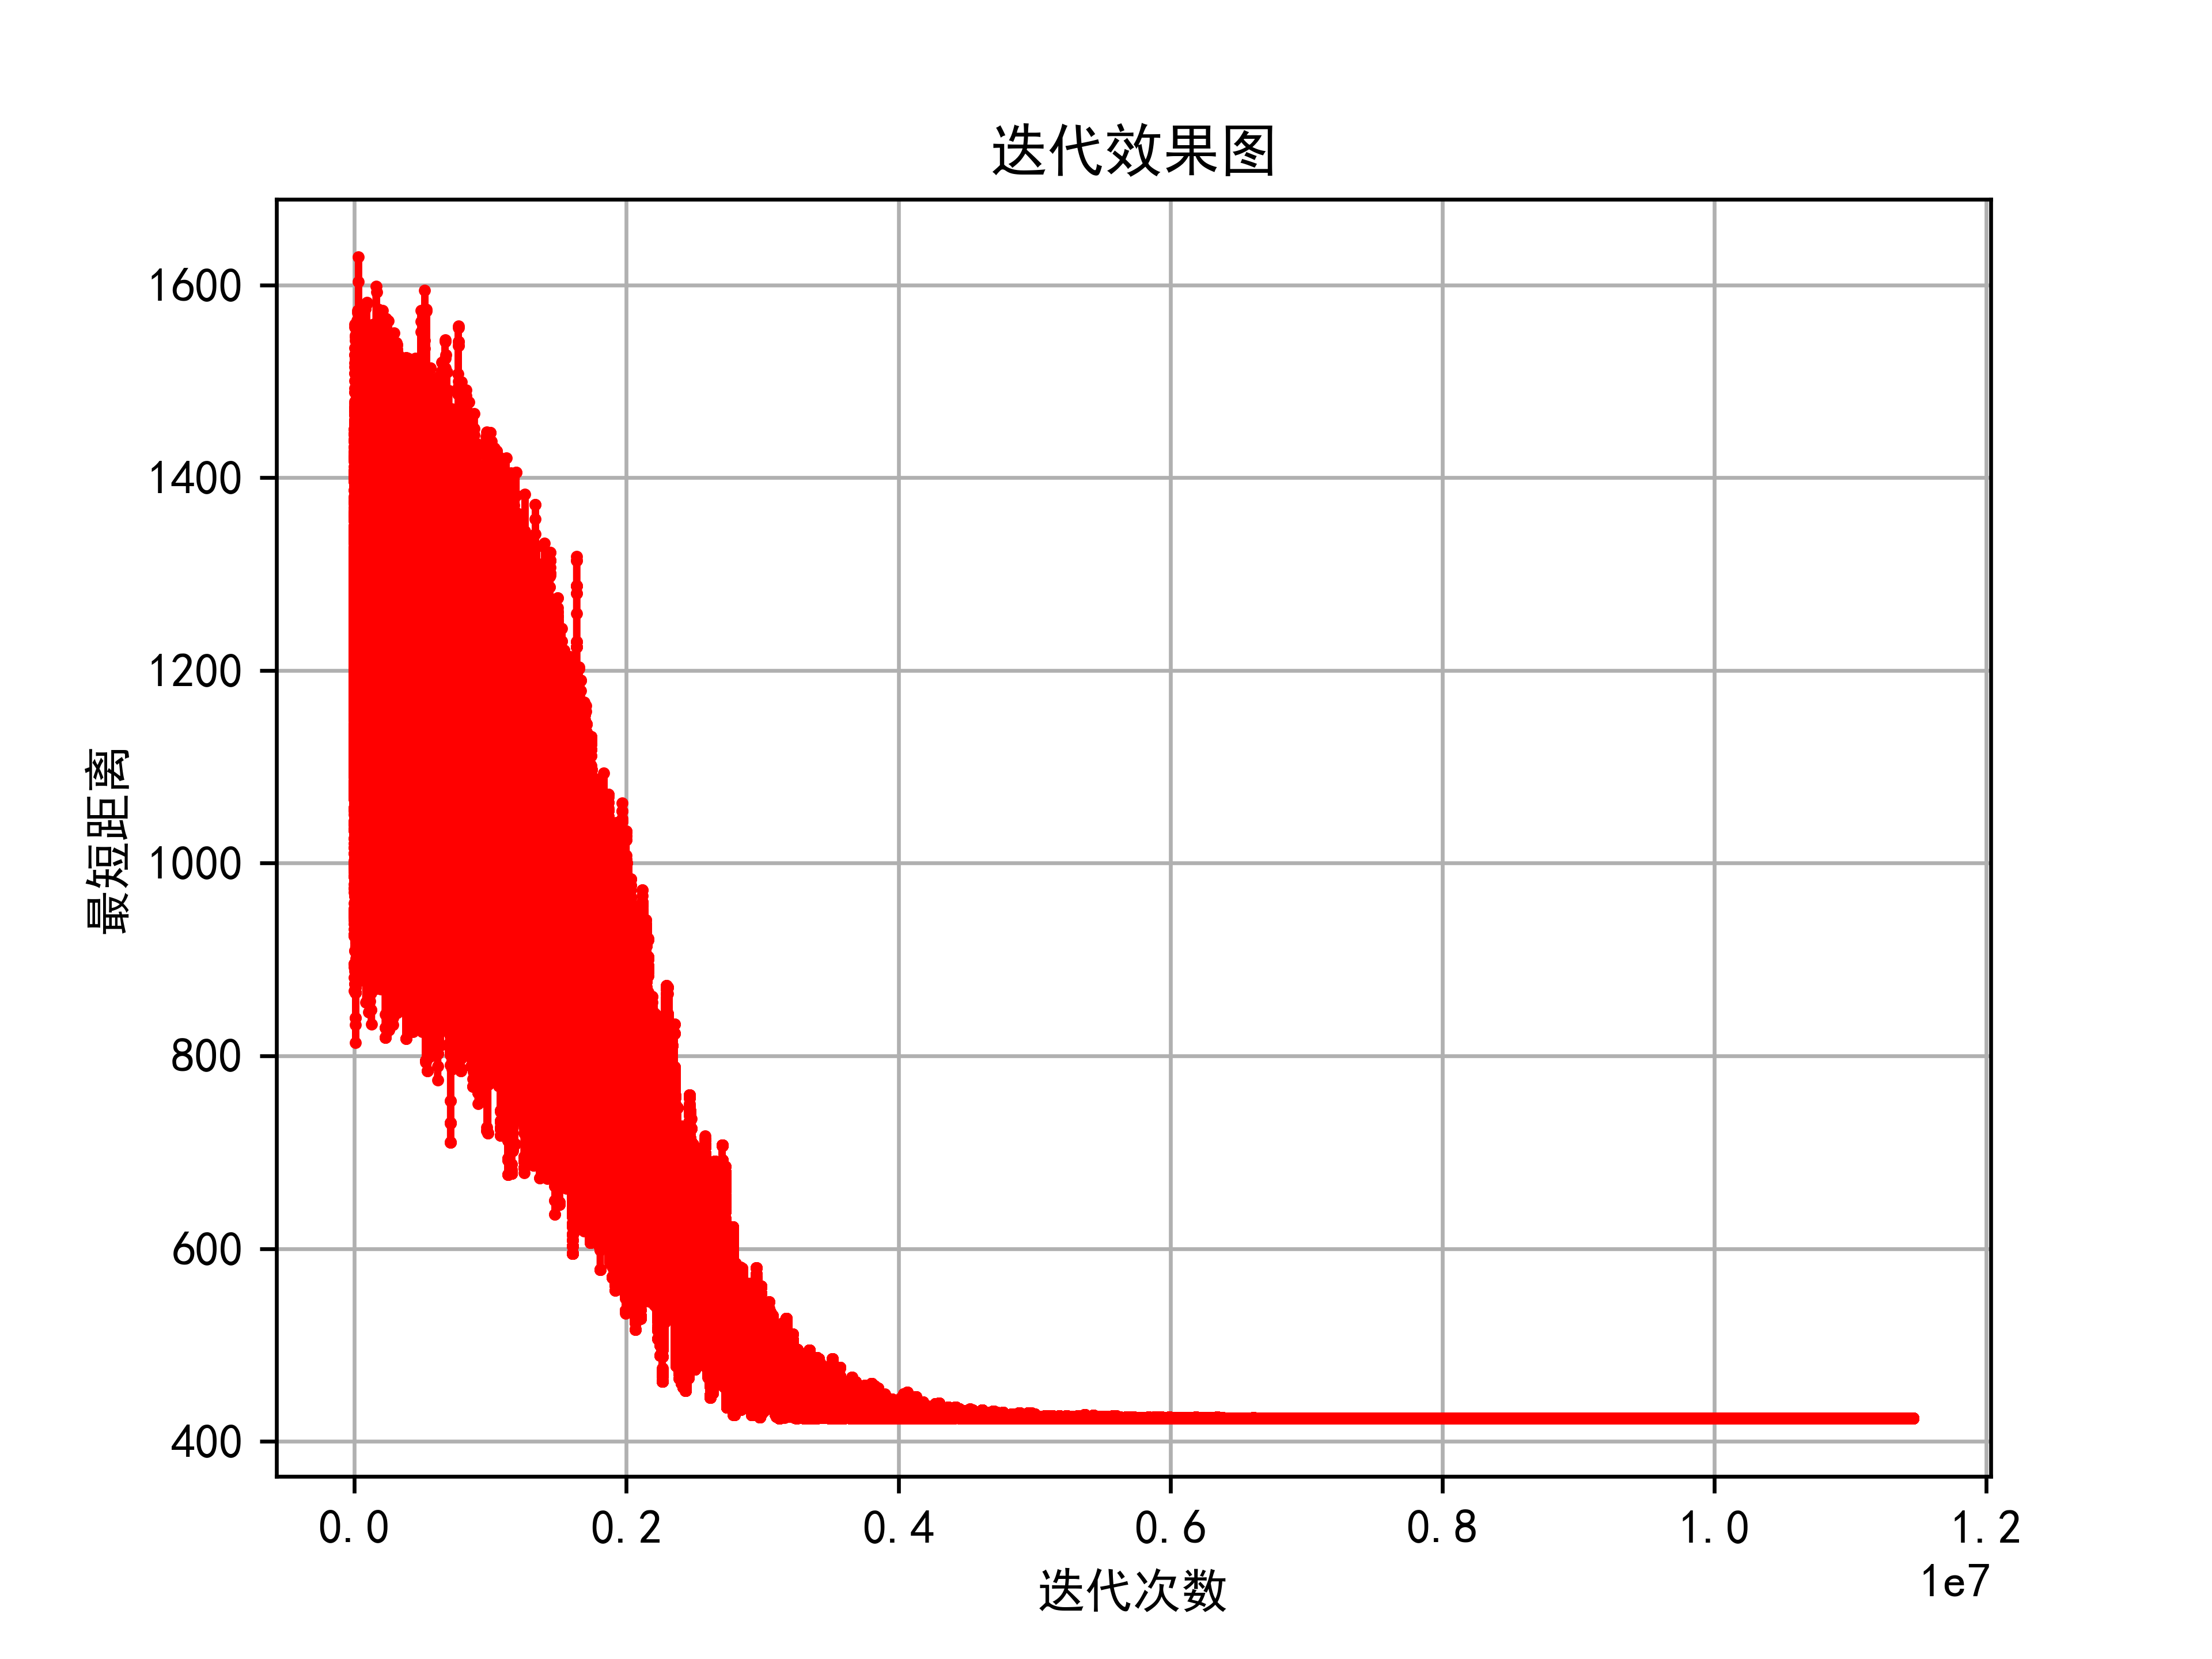
plt.plot(sensibility,marker='.',color='r',markersize=3)
plt.title('最短路径坐标图')
plt.xlabel('迭代次数')
plt.ylabel('最短距离')
plt.grid(True)
plt.show()'''输出结果'''
print('最短距离:', dis)
print('最短路径:', path)
print('运行时间:', elapsed_time, '秒')
最短距离: 424.69177537685437
最短路径: [0, 5, 4, 3, 12, 11, 29, 22, 21, 16, 15, 28, 27, 26, 25, 24, 23, 14, 13, 7, 9, 20, 19, 18, 6, 10, 8, 2, 17, 1]
运行时间: 43.86513066291809 秒


![[OpenWrt]RAX3000一根线实现上网和看IPTV](http://pic.xiahunao.cn/[OpenWrt]RAX3000一根线实现上网和看IPTV)


)


