Matplotlib允许用户在同一图表中创建多个子图,以及在同一图表中显示多个图形。
在本篇文章中,我们将详细介绍这两种功能,并通过案例演示,帮助你更好地利用Matplotlib进行图表定制。
1、创建包含多个子图的图表
Matplotlib提供了plt.subplots方法,方便用户创建包含多个子图的图表。
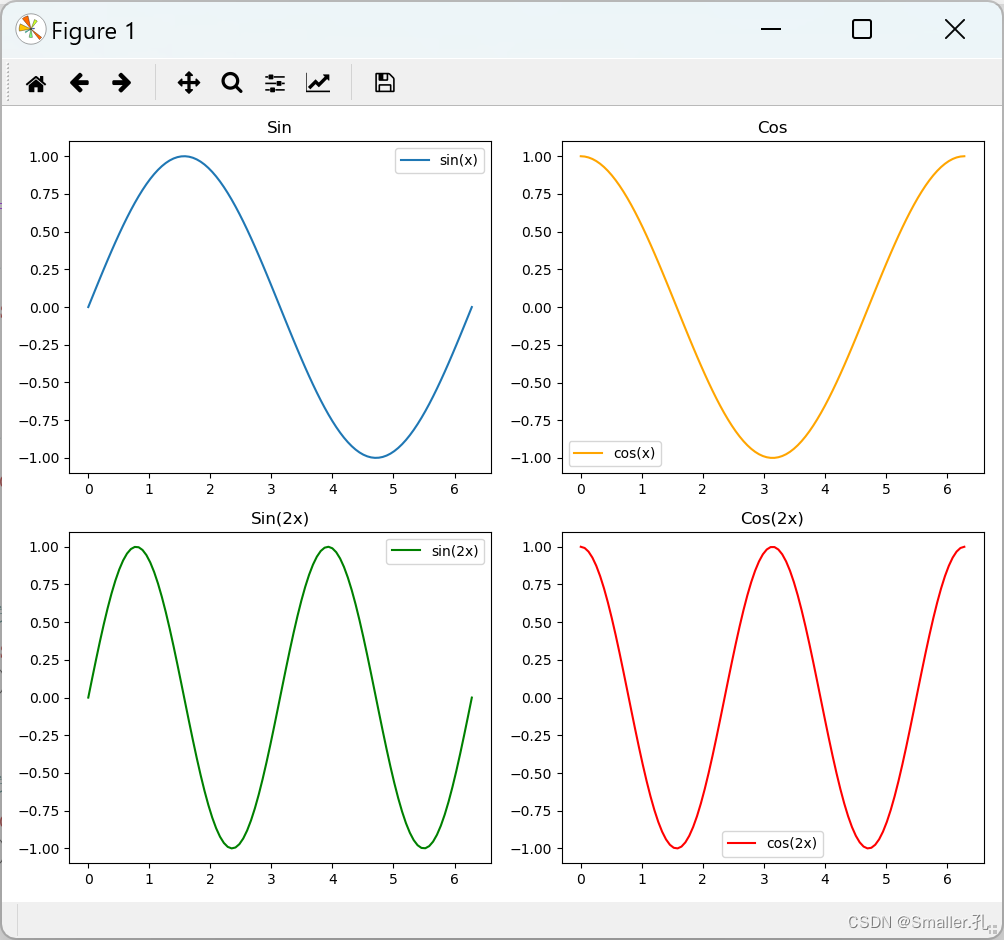
以下是一个简单的例子,演示如何使用Matplotlib创建包含4个子图的图表:
%matplotlib
import matplotlib.pyplot as plt
import numpy as np# 创建示例数据
x = np.linspace(0, 2 * np.pi, 100)
y1 = np.sin(x)
y2 = np.cos(x)
y3 = np.sin(2 * x)
y4 = np.cos(2 * x)
# 创建包含4个子图的图表
fig, axes = plt.subplots(nrows=2, ncols=2, figsize=(10, 8))# 在第一个子图中绘制sin(x)曲线
axes[0, 0].plot(x, y1, label='sin(x)')
axes[0, 0].set_title('Sin')
axes[0, 0].legend()# 在第二个子图中绘制cos(x)曲线
axes[0, 1].plot(x, y2, label='cos(x)', color='orange')
axes[0, 1].set_title('Cos')
axes[0, 1].legend()# 在第三个子图中绘制sin(2x)曲线
axes[1, 0].plot(x, y3, label='sin(2x)', color='green')
axes[1, 0].set_title('Sin(2x)')
axes[1, 0].legend()# 在第四个子图中绘制cos(2x)曲线
axes[1, 1].plot(x, y4, label='cos(2x)', color='red')
axes[1, 1].set_title('Cos(2x)')
axes[1, 1].legend()# 调整子图之间的间距
plt.tight_layout()# 显示图表
plt.show()
其中nrows=2, ncols=2 分别表示子图的分布,2行2列;
axes[1, 1]是指定子图的位置,从0开始,axes[1, 1]表示第二行第二列的位置

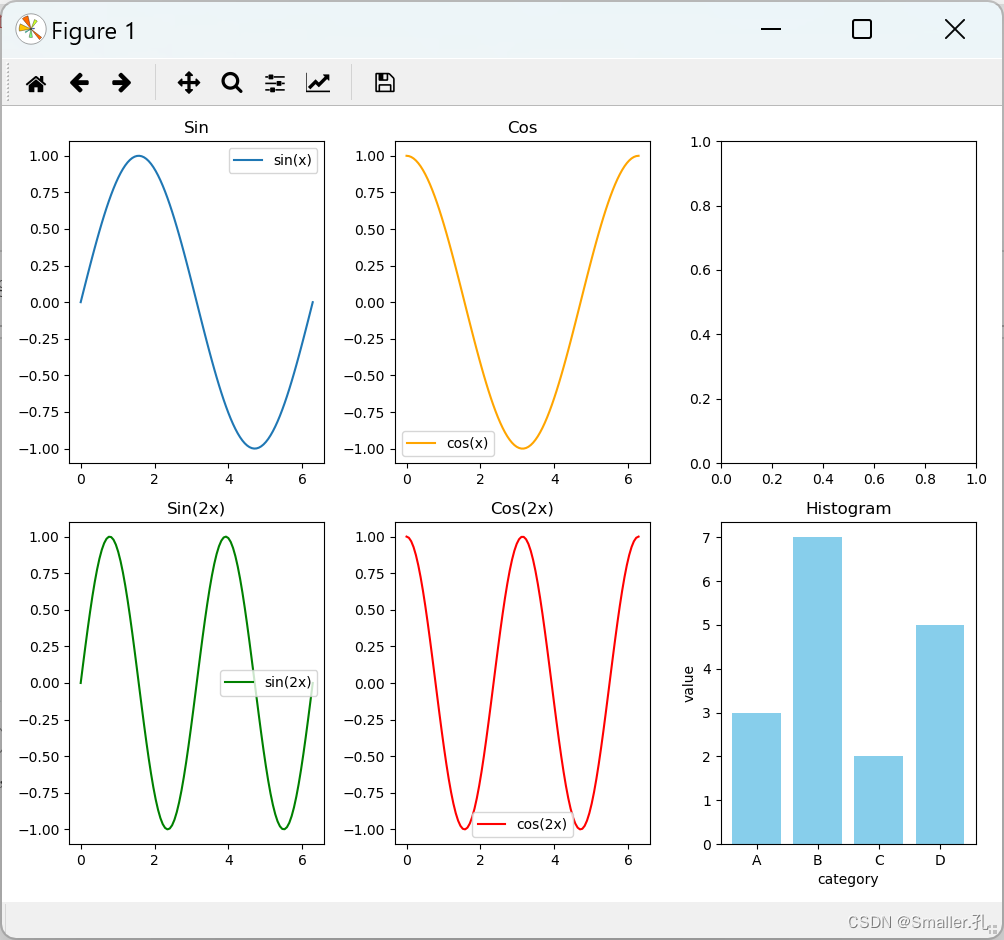
同理如果想创建2X3的分布,那就nrows=2, ncols=3,且最后一个位置为axes[1, 2]
并且每个位置的子表类型随意,可以折线,柱状等。代码如下:
%matplotlib
import matplotlib.pyplot as plt
import numpy as np# 创建示例数据
x = np.linspace(0, 2 * np.pi, 100)
y1 = np.sin(x)
y2 = np.cos(x)
y3 = np.sin(2 * x)
y4 = np.cos(2 * x)# 创建包含4个子图的图表
fig, axes = plt.subplots(nrows=2, ncols=3, figsize=(10, 8))# 在第一个子图中绘制sin(x)曲线
axes[0, 0].plot(x, y1, label='sin(x)')
axes[0, 0].set_title('Sin')
axes[0, 0].legend()# 在第二个子图中绘制cos(x)曲线
axes[0, 1].plot(x, y2, label='cos(x)', color='orange')
axes[0, 1].set_title('Cos')
axes[0, 1].legend()# 在第三个子图中绘制sin(2x)曲线
axes[1, 0].plot(x, y3, label='sin(2x)', color='green')
axes[1, 0].set_title('Sin(2x)')
axes[1, 0].legend()# 在第四个子图中绘制cos(2x)曲线
axes[1, 1].plot(x, y4, label='cos(2x)', color='red')
axes[1, 1].set_title('Cos(2x)')
axes[1, 1].legend()# 在第六个子图中绘制柱状图
# 生成示例数据
categories = ['A', 'B', 'C', 'D']
values = [3, 7, 2, 5]# 绘制柱状图
axes[1, 2].bar(categories, values, color='skyblue')
axes[1, 2].set_xlabel('category')
axes[1, 2].set_ylabel('value')
axes[1, 2].set_title('Histogram')# 调整子图之间的间距
plt.tight_layout()# 显示图表
plt.show()
第五个图没有绘制,所以是空的

2、在同一图表显示多个图形
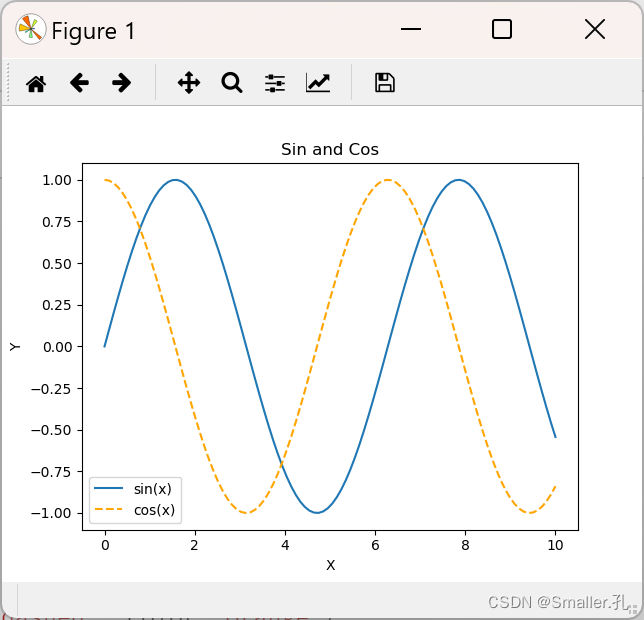
Matplotlib允许用户在同一图表中显示多个图形,这可以通过多次调用绘图方法来实现。以下是一个示例:
%matplotlib
import matplotlib.pyplot as plt
import numpy as np# 示例数据
x = np.linspace(0, 10, 100)
y1 = np.sin(x)
y2 = np.cos(x)# 在同一图表中显示sin和cos曲线
plt.plot(x, y1, label='sin(x)')
plt.plot(x, y2, label='cos(x)', linestyle='dashed', color='orange')# 添加标题和图例
plt.title('Sin and Cos')
plt.xlabel('X')
plt.ylabel('Y')
plt.legend()plt.show()

在这个例子中,我们通过两次调用plt.plot方法,在同一图表中绘制了sin和cos曲线,并设置了标题和图例。
通过这两种方法,你可以更灵活地组织和展示你的数据,使图表更具信息性。
真题解析#中国电子学会#全国青少年软件编程等级考试)


,支持2018-2023版本)


![[个人笔记] Git的CLI笔录](http://pic.xiahunao.cn/[个人笔记] Git的CLI笔录)
,根据遍历序列重构二叉树,递归输入建树(树的定义,结构体细节,typedef))


)
)


